Introduction
We will setup Stand Alone Elastic Agent. We will perform one demonstration that ships data to an Elasticsearch instance. We will perform a second demonstration that ships data to a Logstash Instance.
If you do not have Elasticsearch and Kibana set up yet, then follow these instructions.
This video assumes you are using Publicly Signed Certificates for your Elasticsearch. If you are using Self Signed Certificates, you simply needs to reference Certificate Authorities in your elastic-agent.yml file. (Details TBD).
Requirements
A running instance of Elasticsearch and Kibana. Then two different instances of Ubuntu 20.04 server, one will be used for the Elastic Agent and the other will be used for Logstash.
We assume you already have domains mapped to your elasticsearch and kibana instance. In our video, we used elastic.evermight.net and kibana.evermight.net.
Steps
Step 1 - Download Elastic Agent [02:20]
Download the Elastic Agent package to the Ubuntu machine that will serve the Elastic Agent.
Visit https://www.elastic.co/downloads/elastic-agent to find the latest package.
Unpackage with tar xvfz <file you downloaded>.
Step 2 - Use Elastic Agent with Elasticsearch Output [02:54]
There should be an ~/elastic-agent.yml file from Step 1.
Edit these fields for the ~/elastic-agent.yml for connection to your Elasticsearch server
...etc...
outputs:
  default:
    type: elasticsearch
    hosts: ["https://elastic.evermight.net:9200"]
    username: "elastic"
    password: "changeme"
...etc...
If you are using self-signed certificates, you may need to copy the certificate authority to this machine and reference it with the ssl.certificate_authorities field as mentioned in this documentation:
Elastic Agent SSL Configuration - We have not tested this approach yet.
Start your elastic agent with this command:
./elastic-agent install
... answer No to fleet server
Confirm success by going to Kibana and go to menu to click Stack Management > Index Management > Data Streams. You will notice some data streams such as logs-elastic_agent* and metrics-elastic*.
Step 3 - Use Elastic Agent with Logstash Output [07:52]
Set up Logstash
Go to your other Ubuntu machine that you plan to run Logstash on. Run these commands to install Logstash.
wget -qO - https://artifacts.elastic.co/GPG-KEY-elasticsearch | sudo gpg --dearmor -o /usr/share/keyrings/elasticsearch-keyring.gpg;
echo 'deb [signed-by=/usr/share/keyrings/elasticsearch-keyring.gpg] https://artifacts.elastic.co/packages/8.x/apt stable main' | sudo tee /etc/apt/sources.list.d/elastic-8.x.list;
apt-get install -y apt-transport-https;
apt-get install -y logstash;
Create a Logstash configuration pipeline file. We will make it as /root/logstash.conf with the following content:
input {
  elastic_agent {
    port => 5044
  }
}
output {
  stdout {}
}
Start Logstash with this command:
/usr/share/logstash/bin/logstash -f /root/logstash.conf
Note The -f /root/logstash.conf must be using absolute paths. I found that relative paths do not work.
Configure and start Elastic Agent
Edit these fields for the ~/elastic-agent.yml for connection to your Logstash instance
...etc...
outputs:
  default:
    type: logstash
    hosts: ["<ip address of logstash server>:5044"]
...etc...
Now you must uninstall and re-install the Elastic Agent to run a new instance of Elastic Agent:
``` /usr/bin/elastic-agent uninstall ...answer any prompts
~/elastic-agent install ...answer No to fleet server
```
Confirm the Logstash server is printing content.
Logstash output to Elasticsearch
You can also have Logstash ship data to Elasticsearch by adding another output stage
``` input { elastic_agent { port => 5044 } } output { stdout {} elasticsearch { hosts => ["elastic.evermight.net:9200"] ssl => true user => "elastic" password => "changeme" index => "lslogs" } }
```
Step 4 - Add Integration [14:34]
You can update an elastic agent to include an additional policy. We will demonstrate by adding Apache Web Server to any one of the two servers in the previous steps that already have an Elastic Agent.
Uninstall the Elastic Agent (because it will be replaced later) with this command:
/usr/bin/elastic-agent uninstall
...answer any prompts
Install Apache web server with apt-get install -y apache2.
Go to your browser and visit http://<ip address of server> to confirm the website is functional.
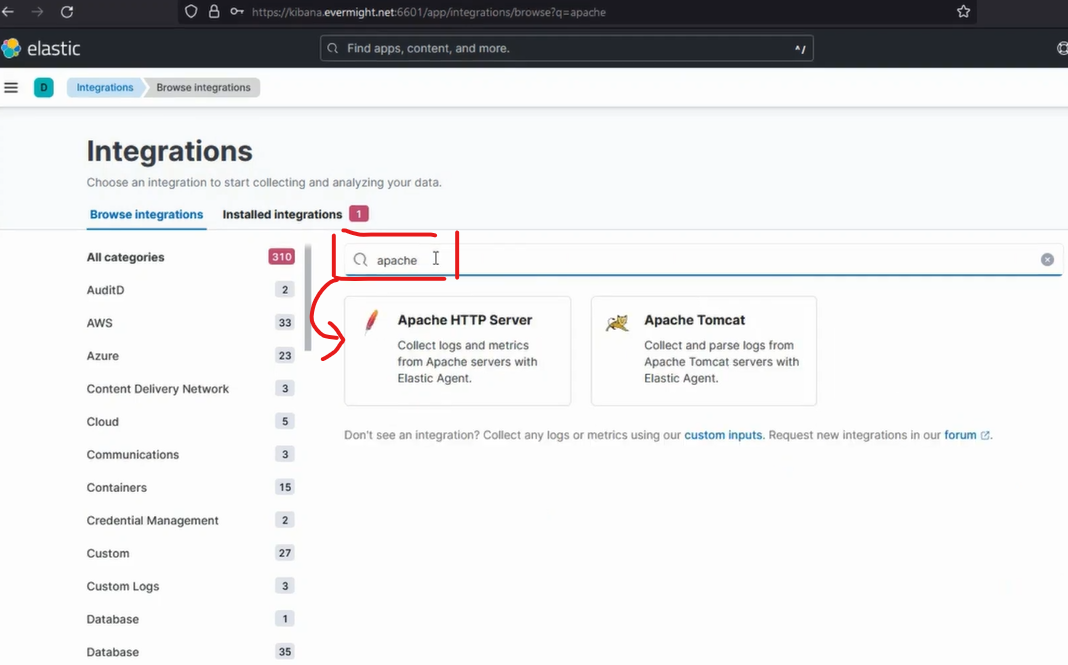
Go to Kibana, click on the Menu and go to Integrations. Then search for Apache HTTP Server.

Press Apache HTTP Server.
Press Add Apache HTTP Server.
Scroll down and press Save and continue.
Press Add Elastic Agent to your hosts.
Click on Run standalone.
Click on Copy to clipboard.

Go back to your server and make a new elastic-agent.yml file and paste in the code from your clipboard.
Edit the credentials in the elastic-agent.yml:
...etc...
outputs:
  default:
    type: elasticsearch
    hosts: ["https://elastic.evermight.net:9200"]
    username: "elastic"
    password: "changeme"
...etc...
Start your elastic agent with this command:
./elastic-agent install
... answer No to fleet server
Visit Kibana > Integrations > Apache HTTP Server > Assets and click on one of the dashboards to confirm data has come in. You can also confirm by going to Kibana > Stack Management > Index Management > Data Streams and you should see some that are related to Apache.
Debugging
If you run into issues, you can find logs for elastic agent in:
Linux: /opt/Elastic/Agent/data/elastic-agent-<id>/logs.
Windows: C:\Program Files\Elastic\Agent\data\elastic-agent-*\logs\
