
Introduction
We will setup Stand Alone Elastic Agent with Windows and Custom Log Integration.
This is a continuation of the Stand Alone Elastic Agent Tutorial.
Requirements
A running instance of Elasticsearch and Kibana.
An Windows 10 or above machine.
Steps
Step 1 - Download Elastic Agent [02:17]
Download the Elastic Agent package to the Windows machine that will serve the Elastic Agent.
Visit https://www.elastic.co/downloads/elastic-agent to find the latest package.
Unzip <file you downloaded>.
Step 2 - Use Elastic Agent with Elasticsearch Output [02:40]
There should be an ~/elastic-agent.yml file from Step 1.
Edit these fields for the ~/elastic-agent.yml for connection to your Elasticsearch server
...etc...
outputs:
  default:
    type: elasticsearch
    hosts: ["https://elastic.evermight.net:9200"]
    username: "elastic"
    password: "changeme"
...etc...
If you are using self-signed certificates, you may need to copy the certificate authority to this machine and reference it with the ssl.certificate_authorities field as mentioned in this documentation:
Elastic Agent SSL Configuration - We have not tested this approach yet.
Go to your Windows Start Menu, search for PowerShell and right click to Run as administrator.
Start your elastic agent with this command:
cd <path to the elastic-agent.yml directory>;
.\elastic-agent.exe install
... answer No to fleet server
Confirm success by going to Kibana and go to menu to click Stack Management > Index Management > Data Streams. You will notice some data streams such as logs-elastic_agent and metrics-elastic*.
Step 3 - Windows Integration [05:00]
Let's ship Windows data to Elasticsearch.
Go to Kibana and click on the Menu.
Go to Integrations.
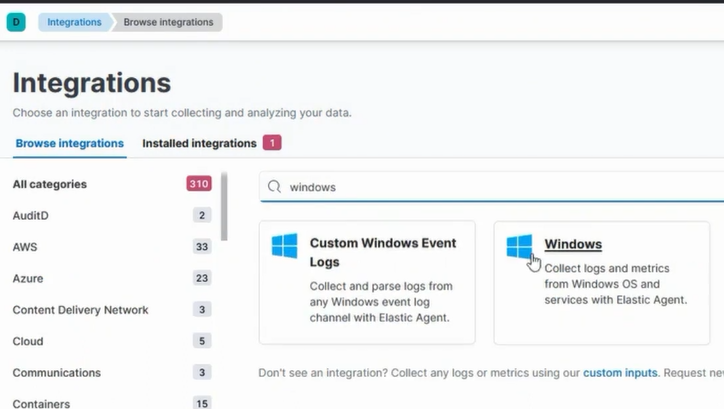
Search for Windows.
Click on Windows.
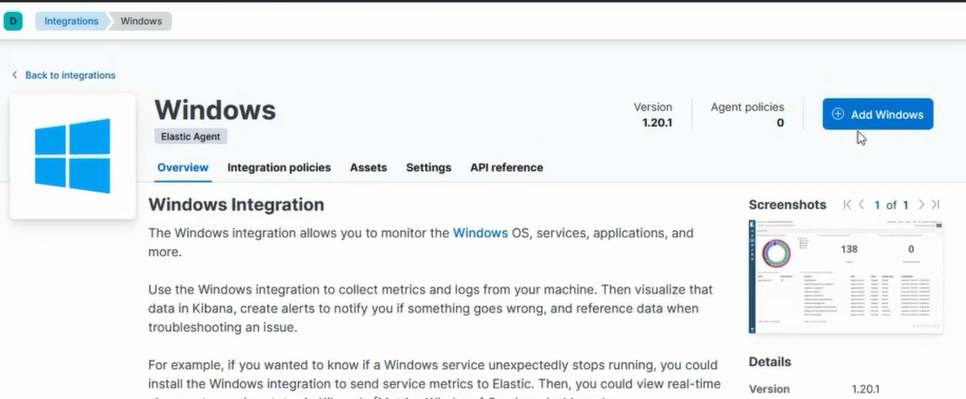
Click on Add Windows.
Go to Where to add this integration.
Go to New agent policy name and type Windows Policy Demo (or anything else you want).
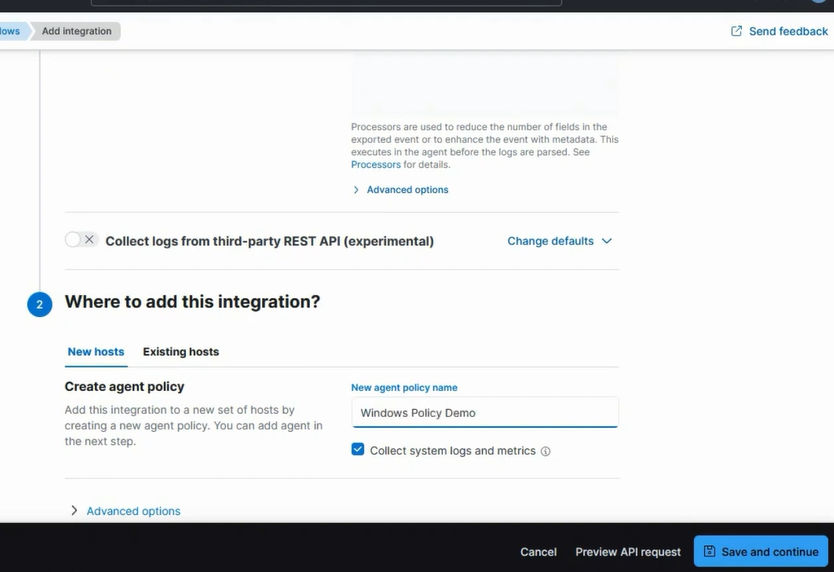
Click Save and continue.
Click Add elastic agent to your host.
Step 4 - Windows Custom Log Integration [06:40]
Let's ship Custom Windows data to Elasticsearch.
Go to Kibana and click on the Menu.
Go to Integrations.
Search for Custom Windows.
Click on Custom Windows Event Logs.
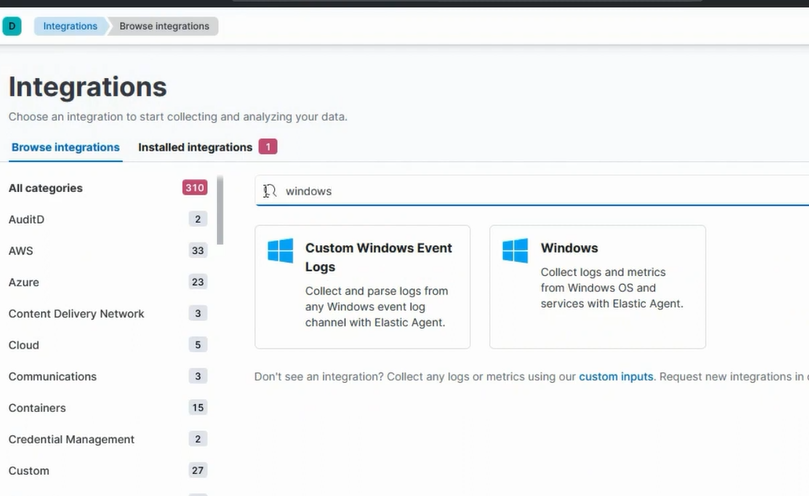
Click on Add Custom Windows Event Logs.
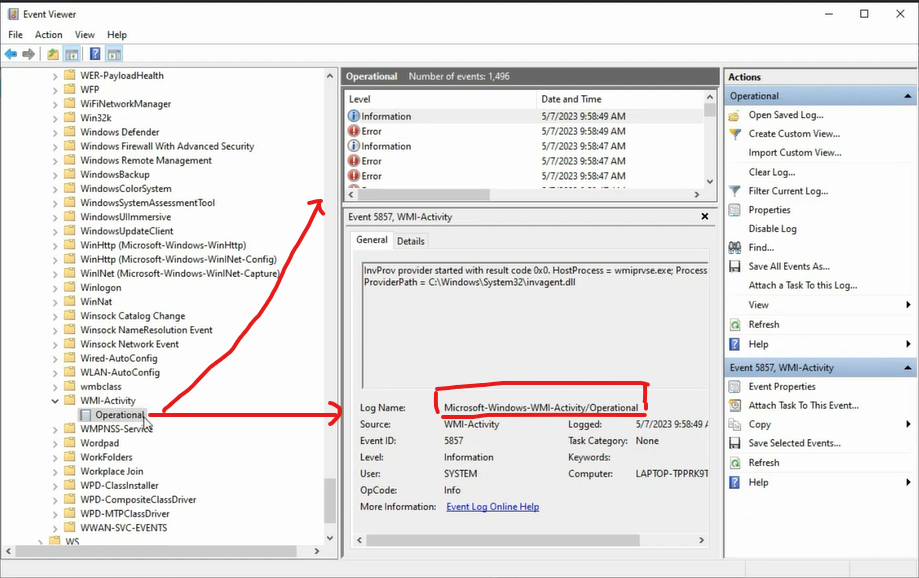
Go to Channel Name and type in the channel of custom windows log you want, for example Microsoft-Windows-WMI-Activity/Operational as shown in this image:
Go to Where to add this integration.
Click Existing hosts.
Go to Agent policy field and choose Windows Policy Demo so this integration can be included.
Click Save and continue.
Click Add elastic agent to your host.
Step 5
Click Run standalone.
Click on Copy to clipboard.
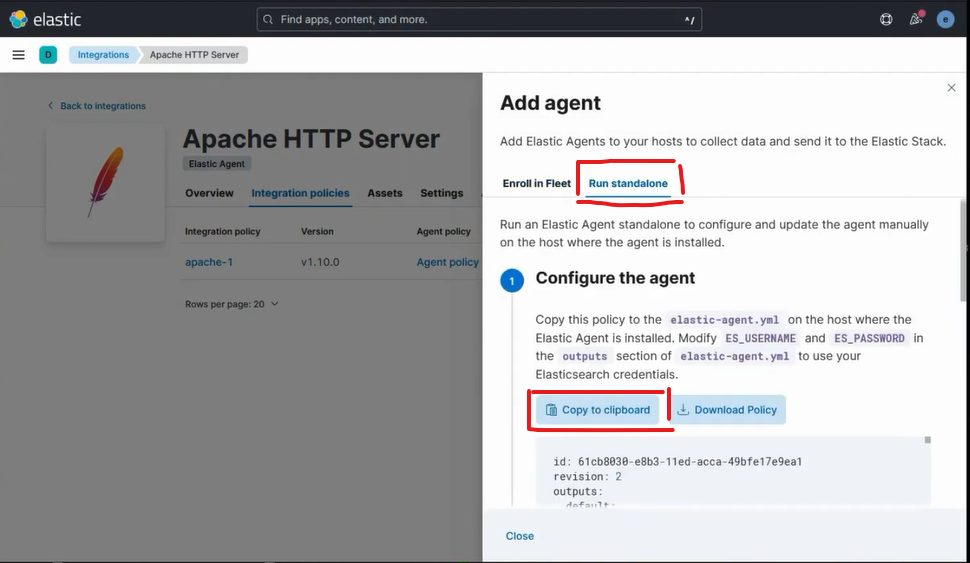
Go back to your server and make a new elastic-agent.yml file and paste in the code from your clipboard.
Edit the credentials in the elastic-agent.yml:
...etc...
outputs:
  default:
    type: elasticsearch
    hosts: ["https://elastic.evermight.net:9200"]
    username: "elastic"
    password: "changeme"
...etc...
Start your elastic agent with this command:
cd C:\Program Files\Elastic\Agent\elastic-agent.exe uninstall;
cd <path to directory of your .\elastic-agent.yml>
.\elastic-agent.exe install
... answer No to fleet server
For Windows data, visit Kibana > Integrations > Windows > Assets and click on one of the dashboards to confirm data has come in.
For Custom Windows Event Logs, recall your Dataset name from the integration:
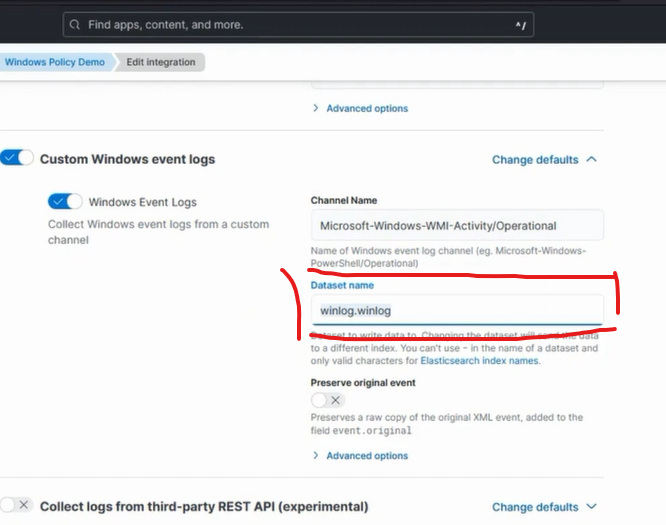
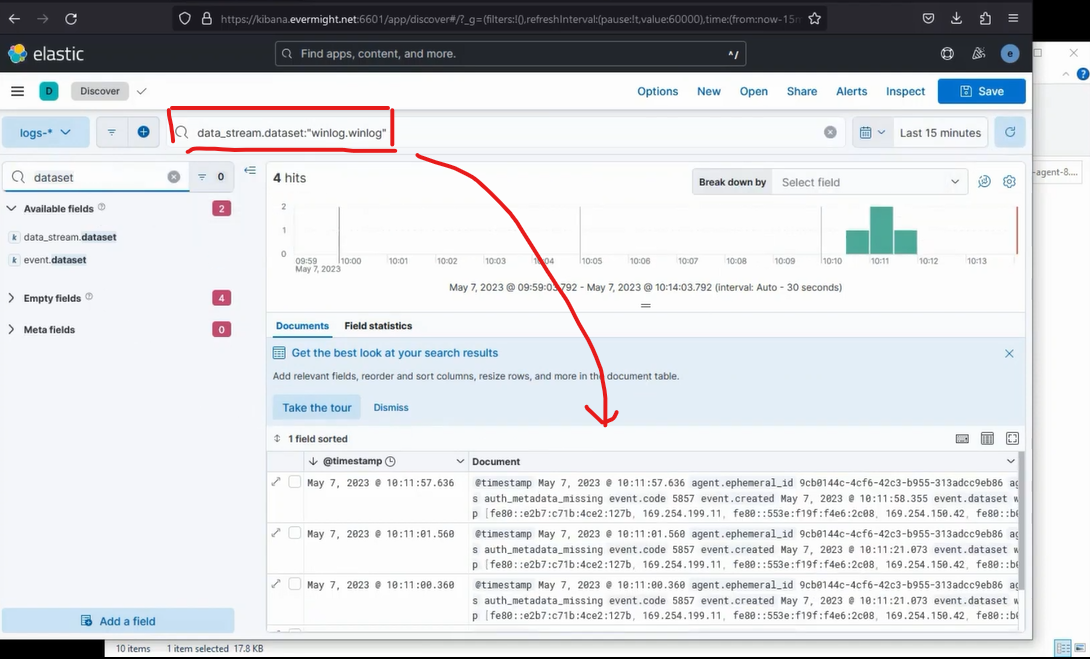
Confirm Custom Windows Event Logs arrive by going to Menu, Discover.
Search for data_stream.dataset: "winlog.winlog" (replace winlog.winlog with your dataset name).
Debugging
If you run into issues, you can find logs for elastic agent in:
Linux: /opt/Elastic/Agent/data/elastic-agent-<id>/logs.
Windows: C:\Program Files\Elastic\Agent\data\elastic-agent-*\logs\
