
Introduction
Code on Github: Elasticsearch and Beats
This tutorial is a continuation of Packetbeat with Elasticsearch Part 1 Install and Secure.
In this tutorial, we will set up Alerts in Kibana, and use Logstash to email you alerts.
Requirements
Resources from Packetbeat with Elasticsearch Part 1 Install and Secure.
Steps
Step 1 - Decide on Rules [02:30]
First, confirm that you have information around network usage in your system. Or any other records of interest that you want to create your alerts and rules around.
Step 2 - Configure Kibana [08:00]
Go to Kibana in the Stack Management > Rules and Connectors. If you see Create your first rule, then skip this step. If you see Additional setup required, then continue with this step.
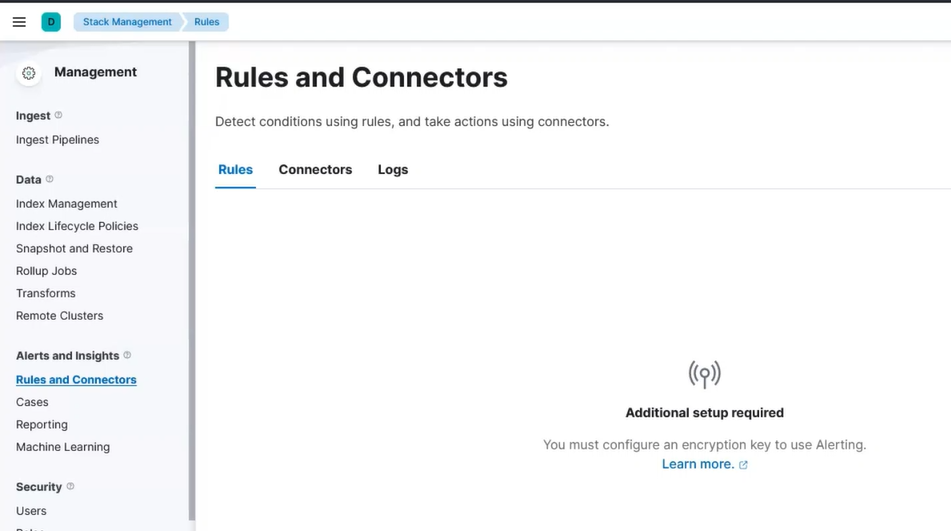 Kibana Alert Setup
Go to your Kibana server shell window and type:
/usr/share/kibana/bin/kibana-keystore add xpack.encryptedSavedObjects.encryptionKey
When prompted, paste in a secret that is at least 32 characters long.
Then restart kibana:
systemctl restart kibana
Visit Kibana in your browser again and visit Stack Management > Rules and Connectors. Now you should be allowed to create your first rule.
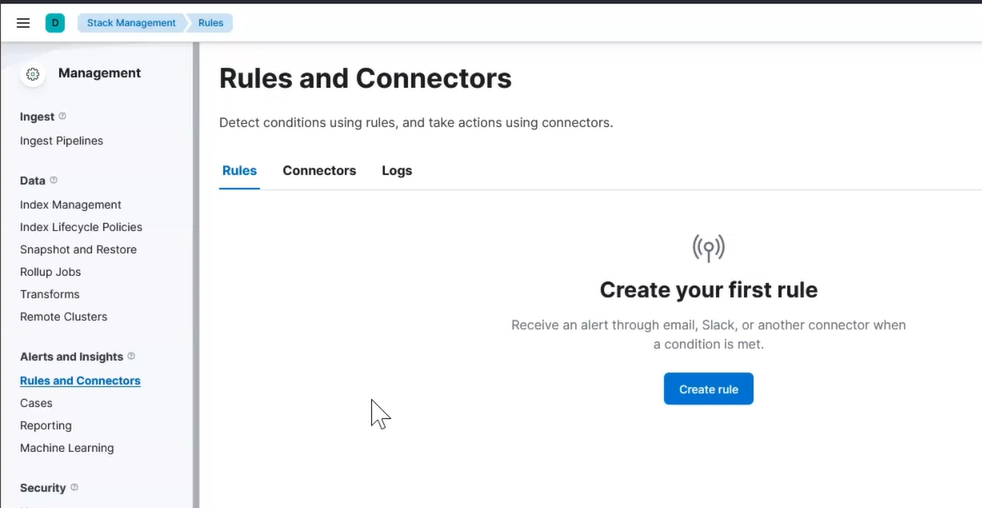 Kibana Alert First Rule
Step 3 - Setup Rule [11:40]
We will create a simple rule to detect any failed ssh login attempt.
Click on Create rule and then fill out the initial fields:
Name: http errors
Check every: 2 minute
Notify: On check intervals
For the Rule Type, select Elasticsearch query > KQL or Lucene as shown in this image:
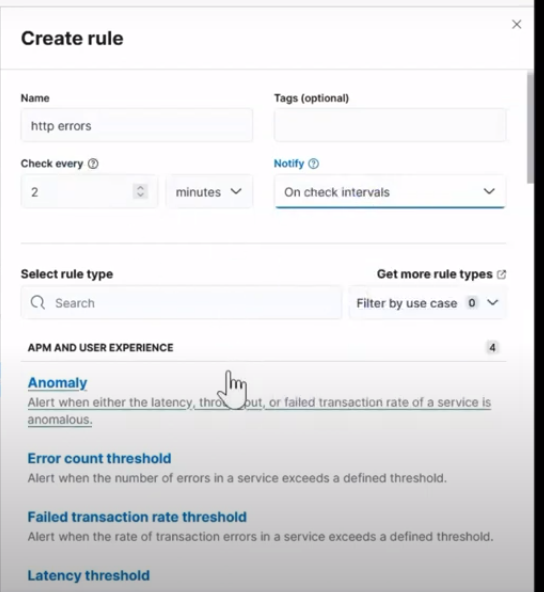 Creating rule type
Then define your query as show in this image:
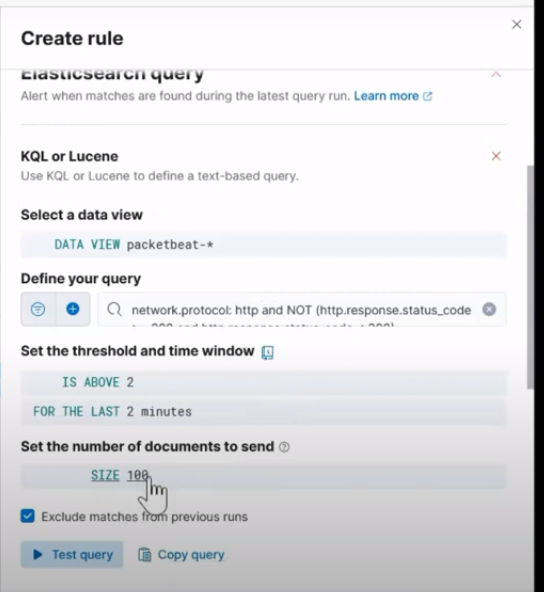 Creating rule query
The define your query is network.protocol: http and NOT (http.response.status_code >= 200 and http.response.status_code < 300)
Set the threshold and time window to IS ABOVE = 2, FOR THE LAST = 2 minute
To test the rule, run th server IP url on a browser such that it triggers the rule. Press save.
Step 4 - Prepare Email Alert Message - Create Server Log Connector [15:20]
We want to output the alerts to a different location so that Logstash can email alerts on our behalf.
Click on Connectors and choose Server logs.
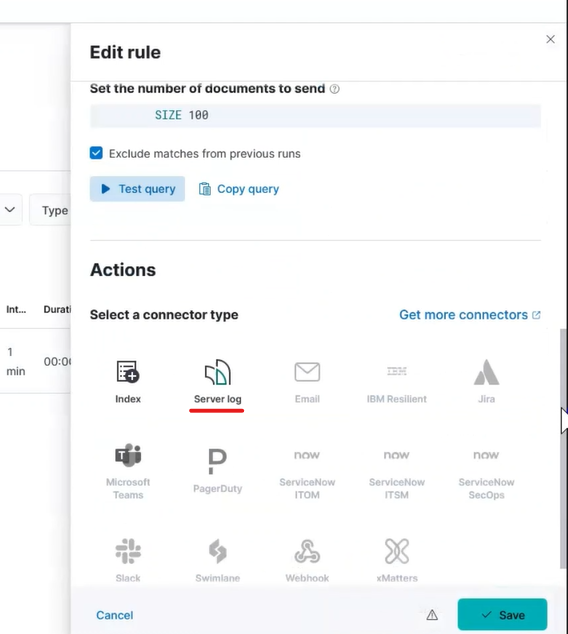 Kibana Alert Server Log
Click Create a connector and type anything meaningful for Connector name in the pop up.
Set the Level to anything that reflects what you deem the alert to be. You can use it as a helpful way to tell Logstash how to filter and transform messages.
If desired, edit the Message. The Message field is what will be delivered via email.
Press save.
After a few minutes, go to your Kibana server and confirm that messages appear in /var/log/kibana.log.
Step 5 - Send Emails with Logstash [20:16]
Go to your Kibana server and install Logstash with this command:
sudo apt-get install -y logstash
Download this logstash file: Logstash file to email alerts
You can place this file anywhere you want. For now we will assume that you placed it in /root/logstash.conf.
In the output stage, fill out the appropriate values for the email connection.
Run Logstash [27:56]
To run logstash and start sending emails as they happen, type this command:
/usr/share/logstash/bin/logstash -f /root/logstash.conf
