
Introduction
We will configure the fleet server to use #logstash as the output.
This Documentation assumes you've set up the elasticsearch and kibana already. If not then you can go here for Publicly Signed Certificates setup. If you want to use Self Signed Certificates, go here TBD.
This Documentation assumes you've watched earlier videos on Elastic Agents, Agent Policies and Fleet Server.
Requirements
- A new instance of Linux machine like Ubuntu 20.04 to act as the Server
- Per Policy output assignment
Logstash Output Server [05:40]
Go to the elasticsearch server terminal. Create a file with the command:
cd /usr/share/elasticsearch/bin
vi make-certs.sh
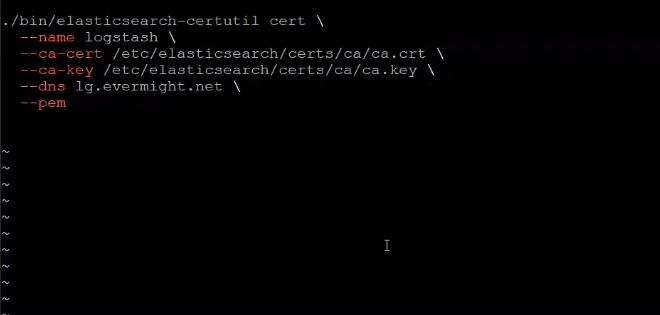
and add the below command, replace the dns variable with the server domain name:
./elasticsearch-certutil cert \
  --name logstash \
  --ca-cert /etc/elasticsearch/certs/ca/ca.crt \
  --ca-key /etc/elasticsearch/certs/ca/ca.key \
  --dns <your.host.name.here> \
  --pem
Save the file. and run the below command:
chmod 755 make-certs.sh
./make-certs.sh
Generate SSL certificate for Logstash
and press enter if prompted to enter desired output. Now go to the directiory where the certificate was zipped, and unzip it:
cd ..
unzip certificate-bundle.zip
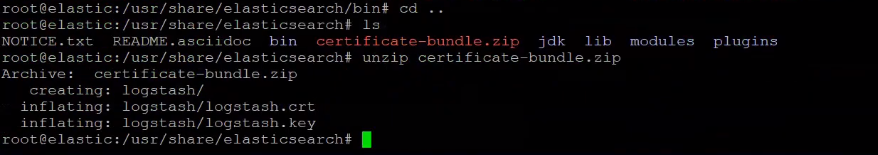
Unzip certificate for Logstash
Go to the Logstash server terminal and run the below commands:
mkdir -p /etc/certs/logstash
cd /etc/certs/logstash/
then copy the contents from the elasticsearch server with the below command:
scp root@<IP ADDRESS OR SERVER DNS>:/usr/share/elasticsearch/logstash/* ./
below is an example command:
scp root@es.evermight.net:/usr/share/elasticsearch/logstash/* ./
then also copy the certificate authority to the logstash server also:
scp root@es.evermight.net:/etc/elasticsearch/certs/ca/ca.crt ./
then run the below command to convert the logstash key to pkcs8:
openssl pkcs8 -inform PEM -in logstash.key -topk8 -nocrypt -outform PEM -out logstash.pkcs8.key
Now let's install logstash in the logstash server:
apt-get update && apt dist-upgrade -y && apt-get install vim curl gnupg gpg;
wget -qO - https://artifacts.elastic.co/GPG-KEY-elasticsearch | sudo gpg --dearmor -o /usr/share/keyrings/elastic-keyring.gpg;
sudo apt-get install apt-transport-https;
echo "deb [signed-by=/usr/share/keyrings/elastic-keyring.gpg] https://artifacts.elastic.co/packages/8.x/apt stable main" | sudo tee -a /etc/apt/sources.list.d/elastic-8.x.list;
sudo apt-get update && sudo apt-get install logstash
open a file for configuration
vi fleet-output.conf
and paste the below contents into the file:
input {
  elastic_agent {
    port => 5044
    ssl_enabled => true
    ssl_certificate_authorities => ["/etc/certs/ca/ca.crt"]
    ssl_certificate => "/etc/certs/logstash/logstash.crt"
    ssl_key => "/etc/certs/logstash/logstash.pkcs8.key"
    ssl_client_authentication => "required"
  }
}
output {
  file {
    path => "fleet-output.txt"
  }
}
and save. Now run the below command:
/usr/share/logstash/bin/logstash -f /root/fleet-output.conf
Now let's create a pipeline configuration for logstash:
mkdir config;
cd config/;
vi pipelines.yml
And paste in the below contents:
- pipeline.id: elastic-agent-pipeline
  path.config: "/root/fleet-output.conf"
and save. Now run it again
cd ~;
/usr/share/logstash/bin/logstash
Enable Trial License [19:40]
Login to Kibana on your browseer. Go to Stack Management > License Management, and click on Start a 30-day trial.
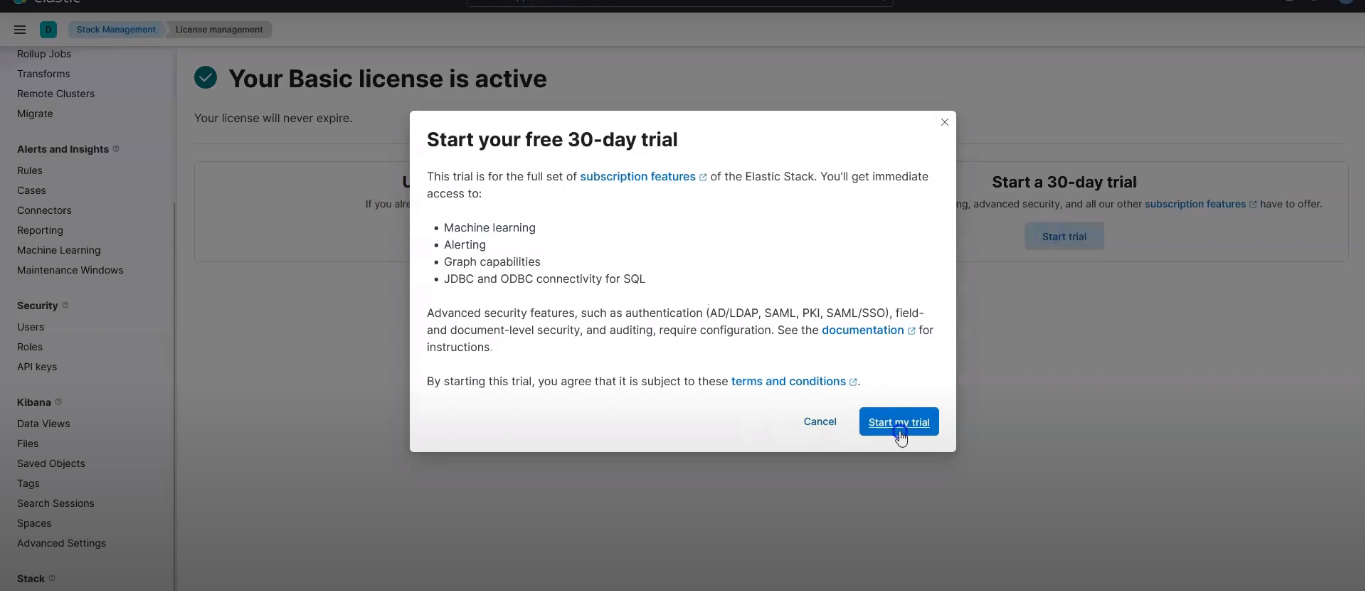 Start 30 days free trial
and it should show a success like this:
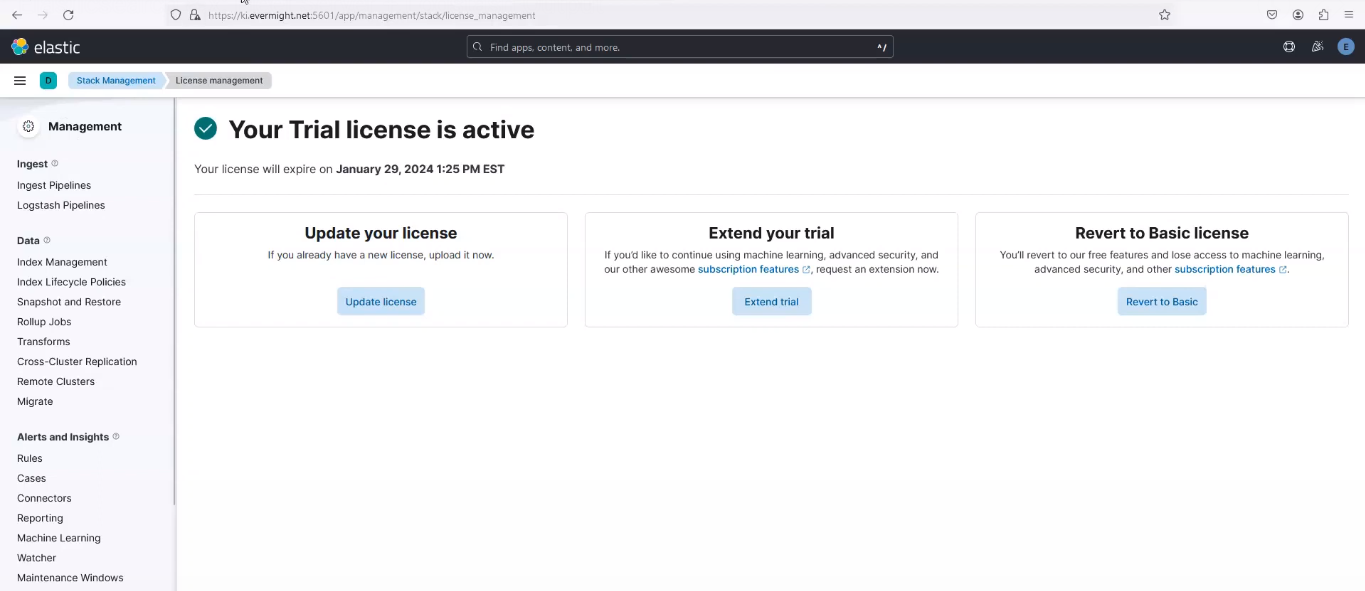 30 days free trial Successfully enabled
Fleet Server: Important Notes [21:00]
We will configure two outputs for Fleet Server, which are;
- Elasticsearch Output
- Logstash Output
Fleet Server: Elasticsearch Output [25:00]
Go to Fleet > settings, and click on the edit pen icon. Reference the below image;
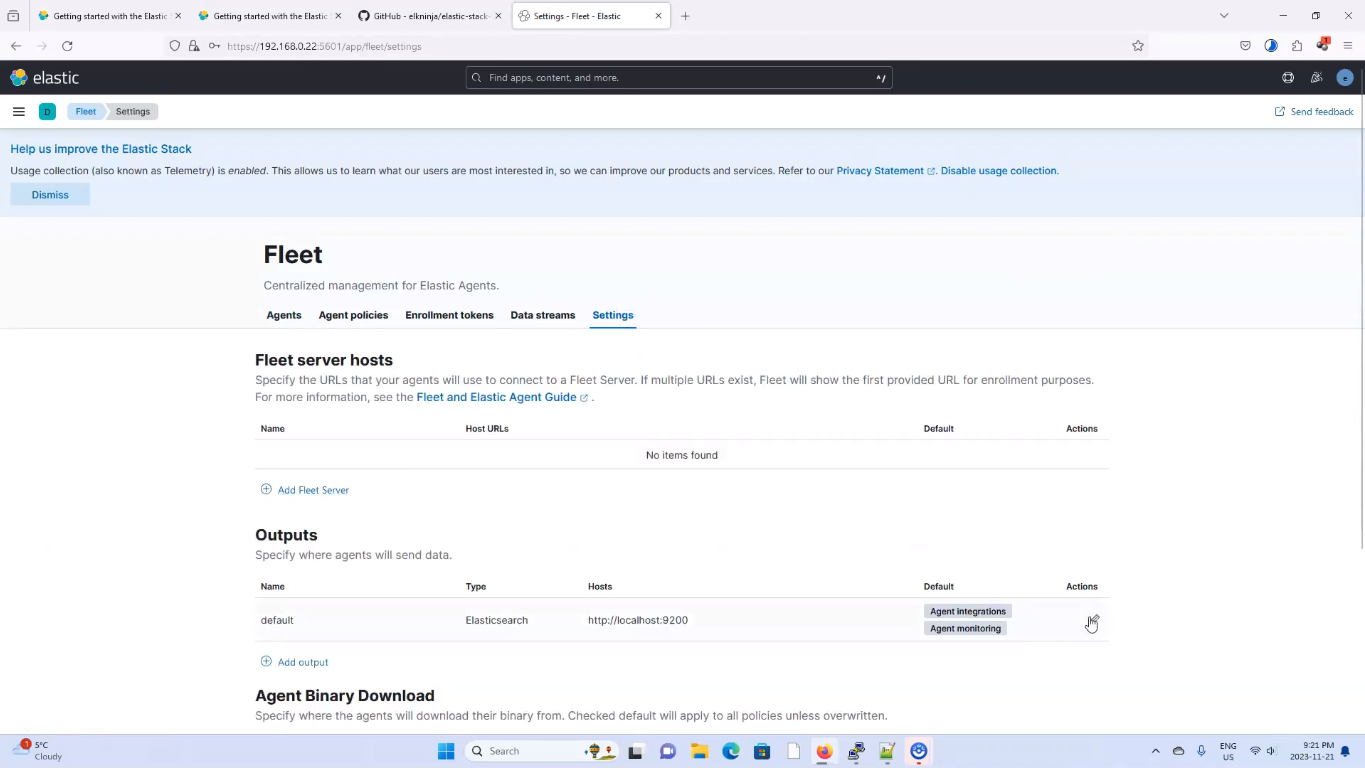 Edit Fleet Server Output
Now go to the elasticsearch server. and Run the below to get the certificate fingerprint.
cd /etc/elasticsearch/certs/ca
openssl x509 -fingerprint -sha256 -noout -in ca.crt | awk -F"=" {' print $2 '} | sed s/://g
create a script.
ca.sh
and add the below contents to it
echo 'ssl:';
echo '  certificate_authorities:';
echo '  - |';
cat ca.crt | sed 's/^/    /'
and save it. Now run the file
chmod 755 ca.sh
./ca.sh
It should look similar to the screenshot below;
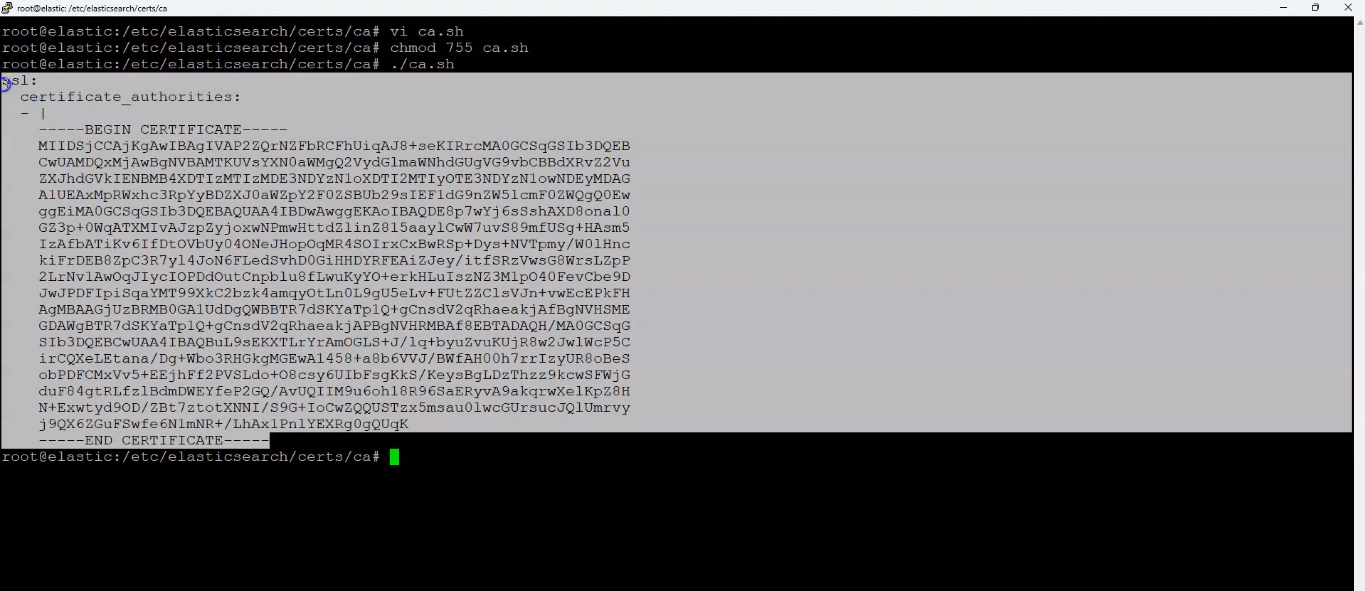 Certificate in YML style
Copy the outputs and paste it in your kibana on the Advance yml configuration space
It should look similar to the screenshot below:
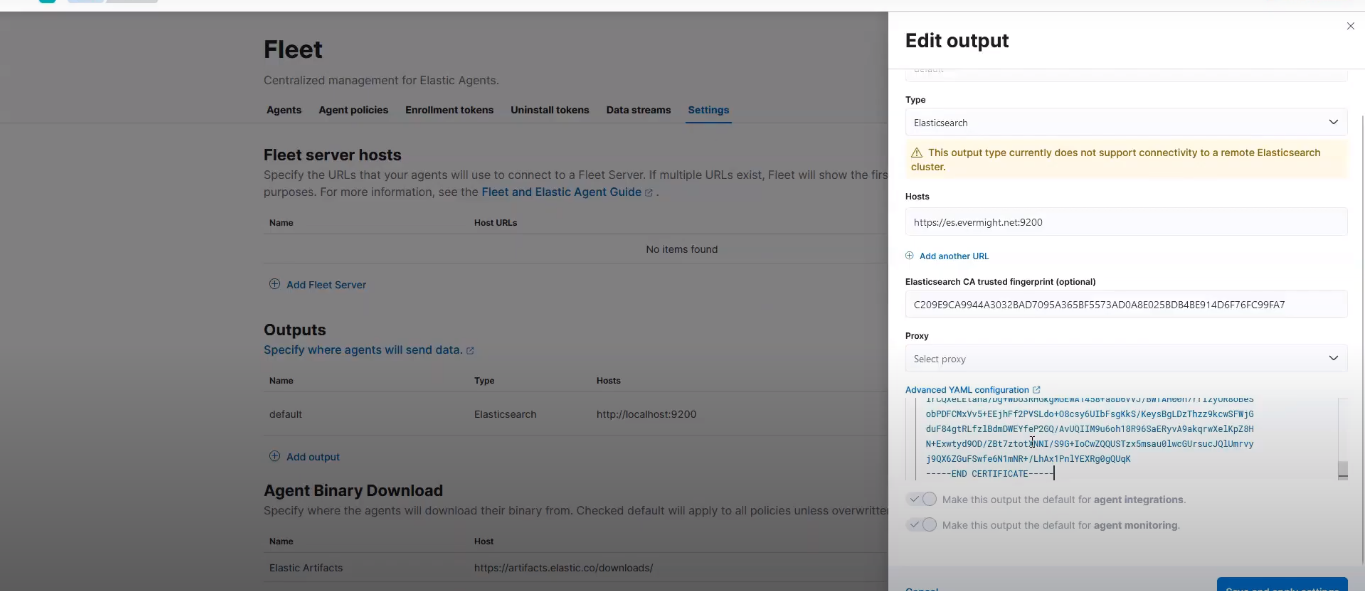 Fleet Server configuration
then click on Save and apply settings, and then proceed to click on Save and deploy.
Fleet Server: Logstash Output [27:43]
Click on Add Output in the Fleet > Agent, to add output for Logstash.
Give it a name like logstash, and for the type select logstash, input the logstash server IP Address or DNS e.g lg.evermight.net:5044, for the Server SSL certificate authorities paste in the ca.crt file contents when printed out and you can use a command like
cat ca.crt
On your elastcsearch server terminal, create a file and follow the below steps to get the client ssl certificate:
cd /usr/share/elasticsearch/bin
vi client-cert.sh
and paste the below contents:
./elasticsearch-certutil cert \
  --name client \
  --ca-cert /etc/elasticsearch/ca/ca.crt \
  --ca-key /etc/elasticsearch/ca/ca.key \
  --pem
and run the below command
chmod 755 client-cert.sh
When prompted, give it a name of client.zip
Now go to the directiory where the certificated was zipped, and unzip it:
cd ..
unzip client.zip
Now go into the directory that was unzipped and copy the contents of the client.crt file:
cd client
cat client.crt
and paste it into the Client SSL certificate section. For the Client SSL certificate key, copy the contents of the client.key and paste it.
cat client.key
Then click on Save and apply settings The two saved outputs will look similar to what is shown in the screenshot below:
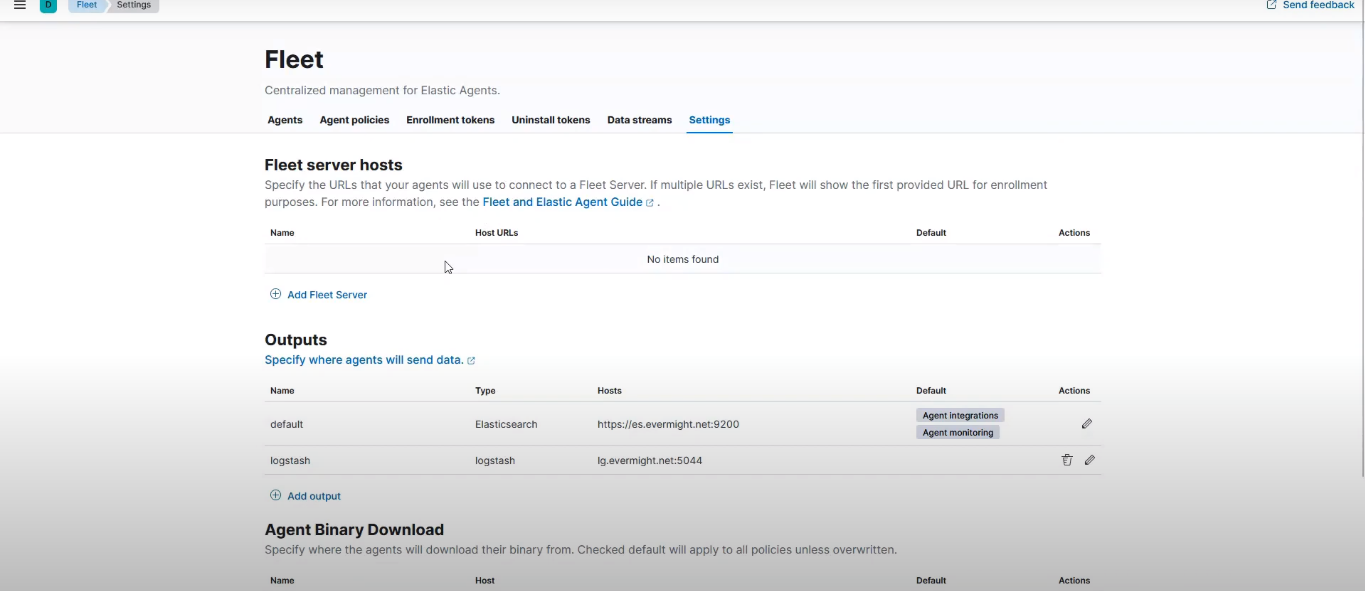 Fleet Server Outputs
Fleet Server: Install [32:01]
Go to the fleet server terminal, and run the below command:
apt-get update && apt dist-upgrade -y && apt-get install -y vim curl gnupg gpg;
and create some directories:
cd /etc/;
mkdir certs;
cd certs/;
mkdir ca;
mkdir fl.evermight.net;
cd ca
Now run this command on the fleet server terminal to copy the certificates from the elastic server to the fleet server
scp root@es.evermight.net:/etc/elasticsearch/certs/ca/ca.crt ./
Now go back to the elastic server and run the following commands:
cd ~
vi fleet-cert.sh
paste the below contents into the file
mkdir /root.ft.evermight.net/
/usr/share/elasticsearch/bin/elasicsearch-certutil cert \
  --out /root/ft.evermight.net/fleet.zip \
  --name fleet \
  --ca-cert /etc/elasticsearch/certs/ca/ca.crt \
  --ca-key /etc/elasticsearch/certs/ca/ca.key \
  --dns ft.evermight.net \
  --pem
and save the file, now run the below commands:
chmod +x fleet-cert.sh;
./fleet-cert.sh
Now go to the directiory where the certificated was zipped, and unzip it:
cd ft.evermight.net/;
unzip fleet.zip;
Now go back to the fleet server terminal, and run the following command:
mv fl.evermight.net ft.evermight.net;
cd ft.evermight.net
Now run this command on the fleet server terminal to copy the certificates from the elastic server to the fleet server
scp root@es.evermight.net:/root/ft.evermight.net/fleet/* ./
Now go back to your kibana, let's create the fleet server policy. click on Add Fleet Server as shown in the screenshot below:
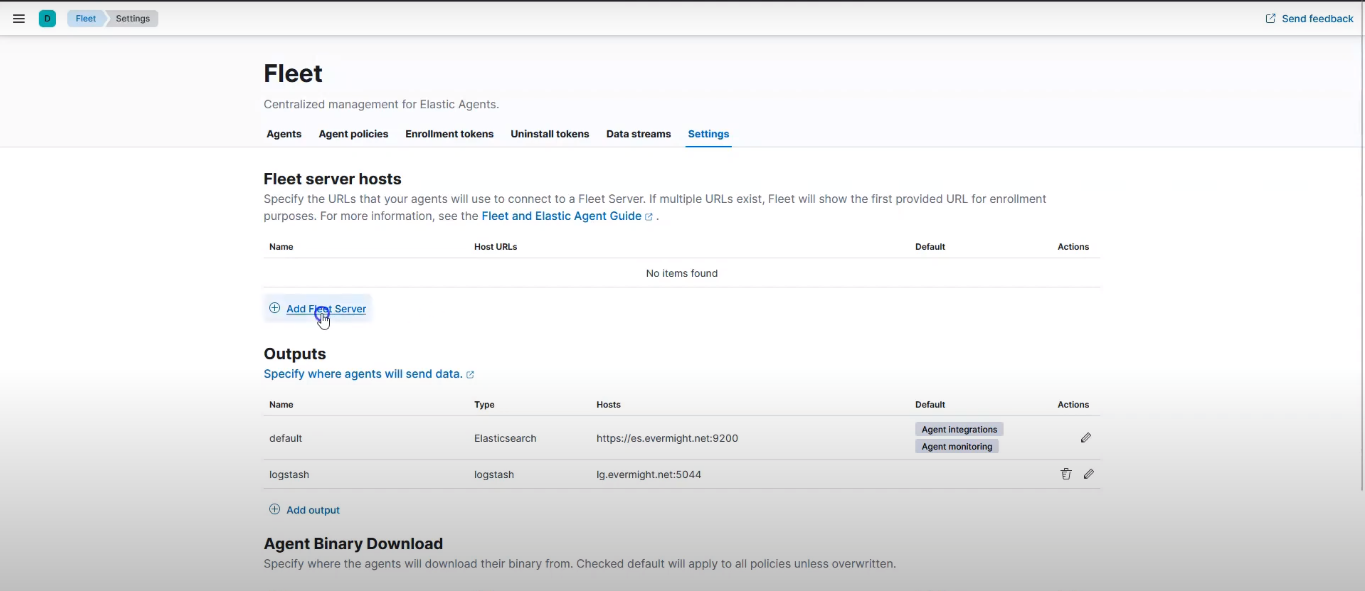 Add a Fleet Server
Go to Advanced, and click on Create Policy as shown in the image below:
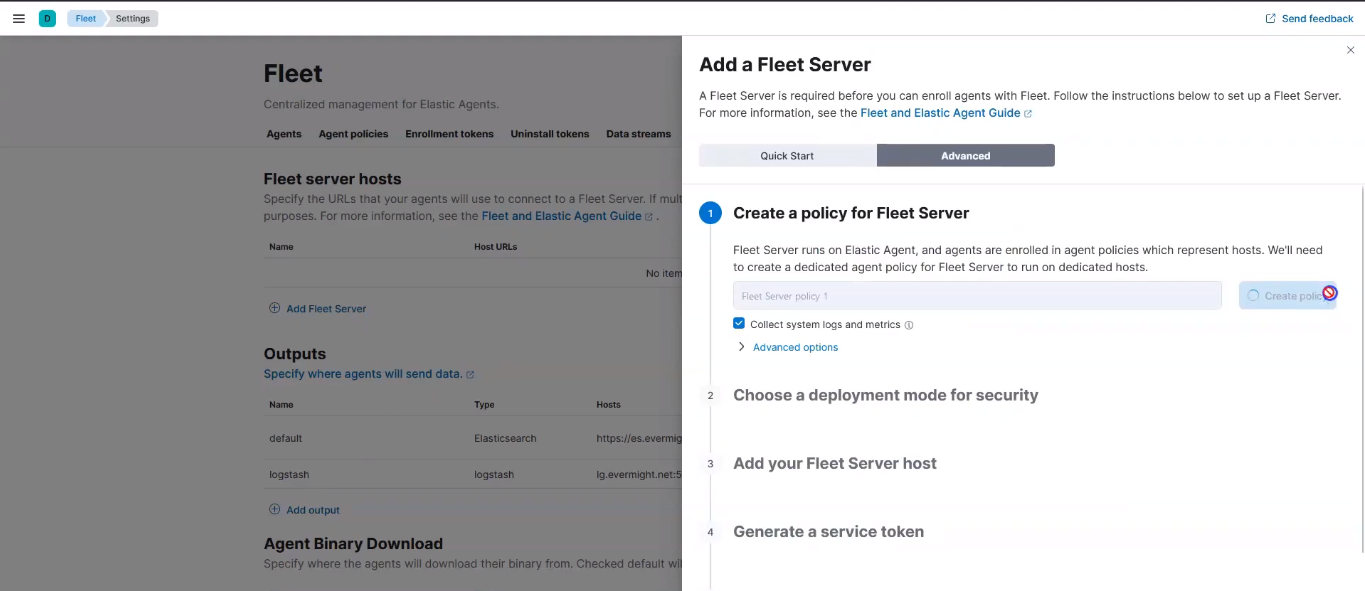 Create Fleet Server Policy
For the Choose a deployment mode for security, click on production.
For the Add your Fleet Server host, in the name section, type in fleet, and in the url section, https://ft.evermight.net:8220.
Then click on Add host. Then click on Generate a service token. Copy the commands on the Install Fleet Server to a centralized host section:
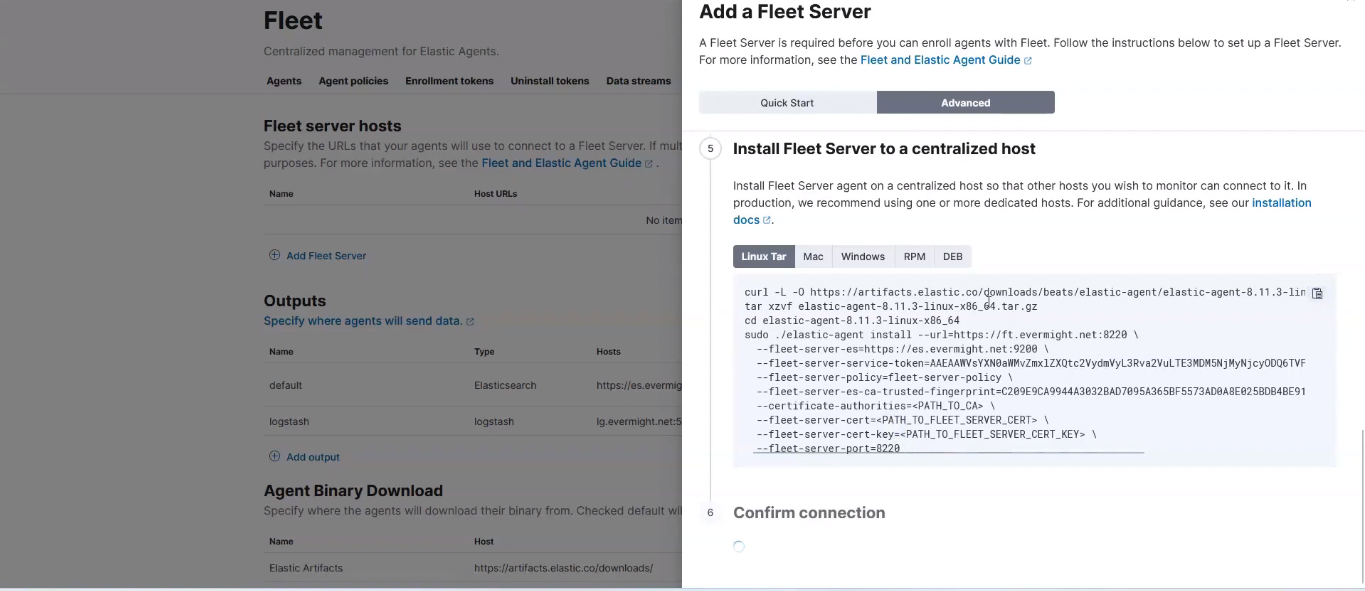 Install Fleet Server to a centralized host command
and on the the fleet server terminal, create a file:
cd ~
vi install.sh
and paste the contents that was copied, and make appropriate edits as shown in the screenshot below:
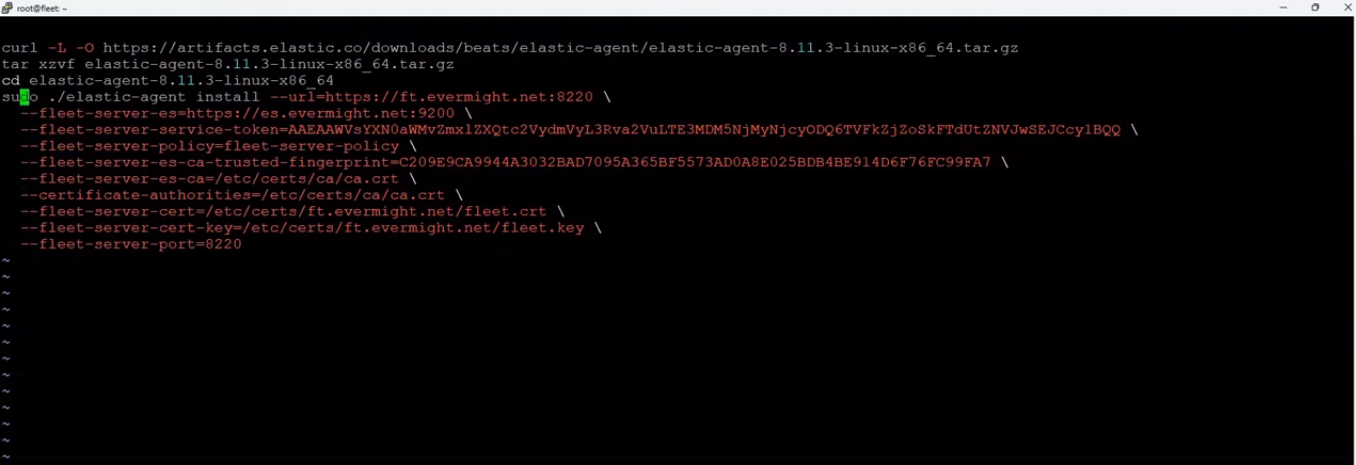 Edited Install Fleet Server to a centralized host command
Then change the permission of the file and run.
chmod +x install.sh
./install.sh
Click on Yes when prompted.
Now in Kibana, go to Fleet > Agent, and refresh the page. You should see a similar output to the below screenshot:
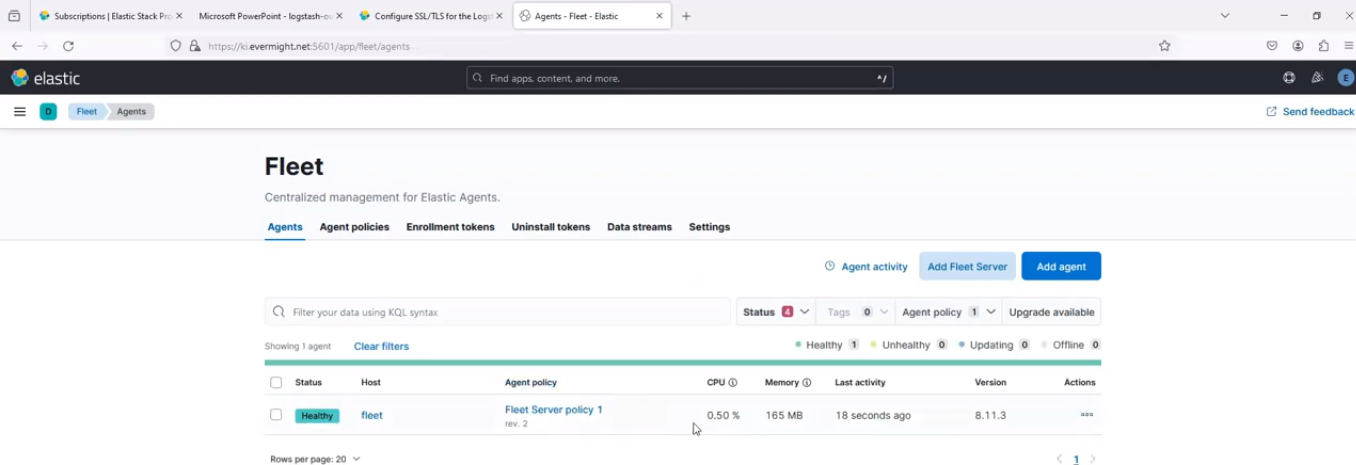 Elastic Agent installed successfully
Elastic Agent: Website on Linux [40:33]
Go to the website server terminal. Install Apache in it:
apt-get install -y apache-2
Visit the ip address of the computer on your browser. In case you don't remember, you can use the command below to get it:
ip a
On Kibana, go to Integrations > Browse Integrations, and search for apache, and click the result as shown in the screenshot below:
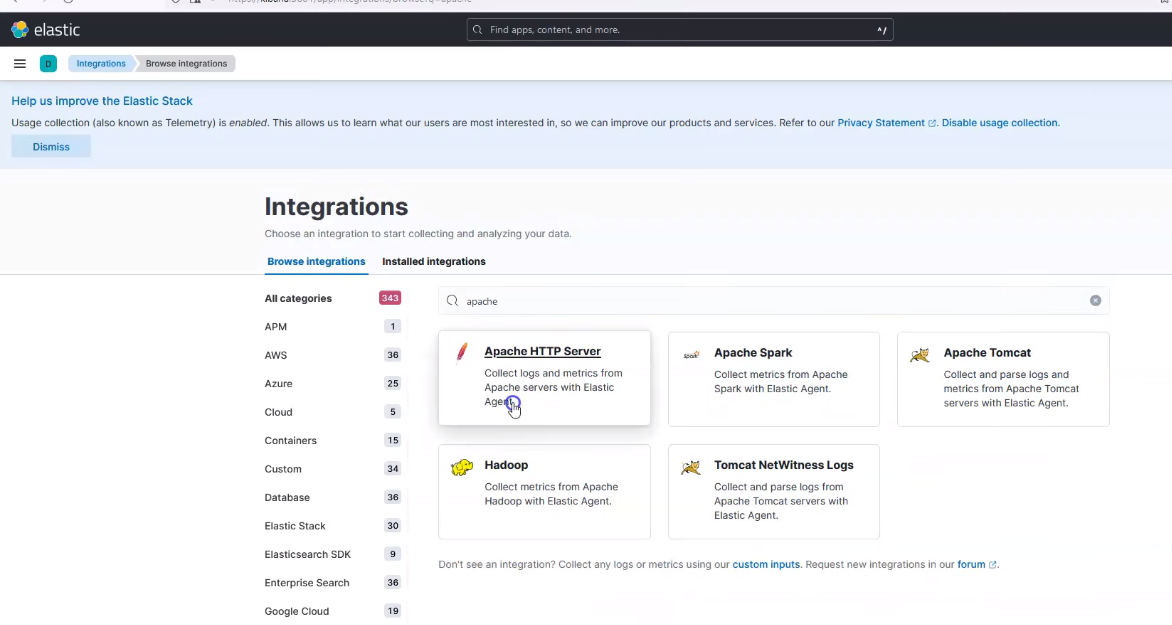 Apache Search
Click on Add Apache HTTP Server by the top right corner.
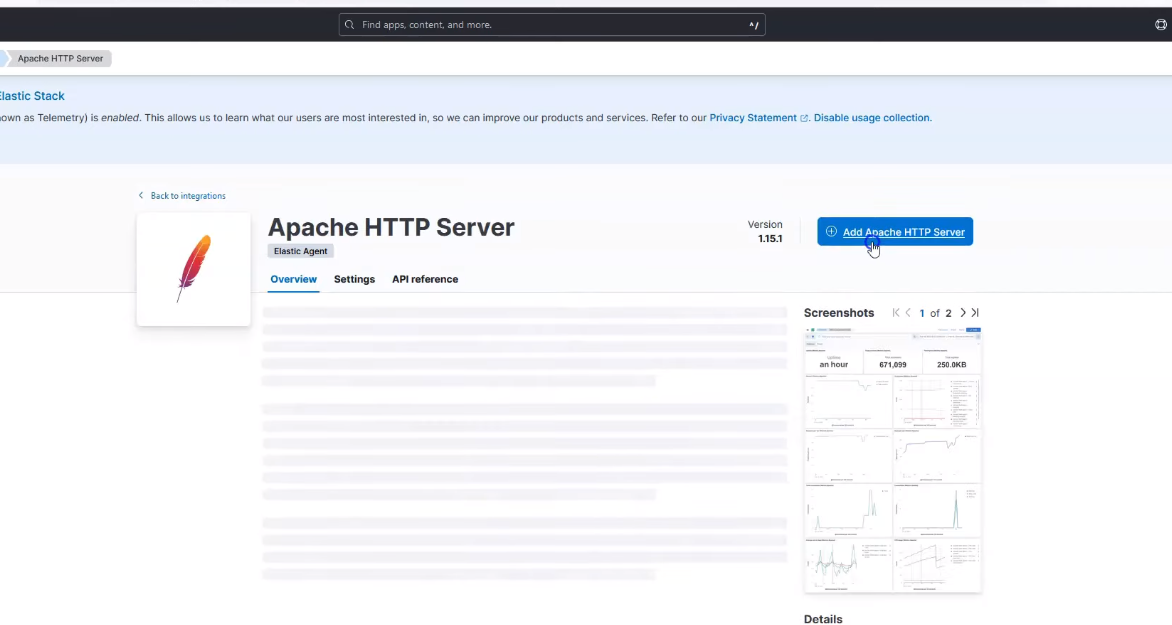 Add Apache
On the Where to add this integration section, under New hosts, click on Advanced options. Scroll down to Output for integrations and change from default to logstash. Scroll down to Output for agent monitoring and change from default to logstash.
Then click on save and continue, then select Add Elastic Agent to your hosts.
Then copy the command to let it be managed by the fleet server. as shown in the screenshot below:
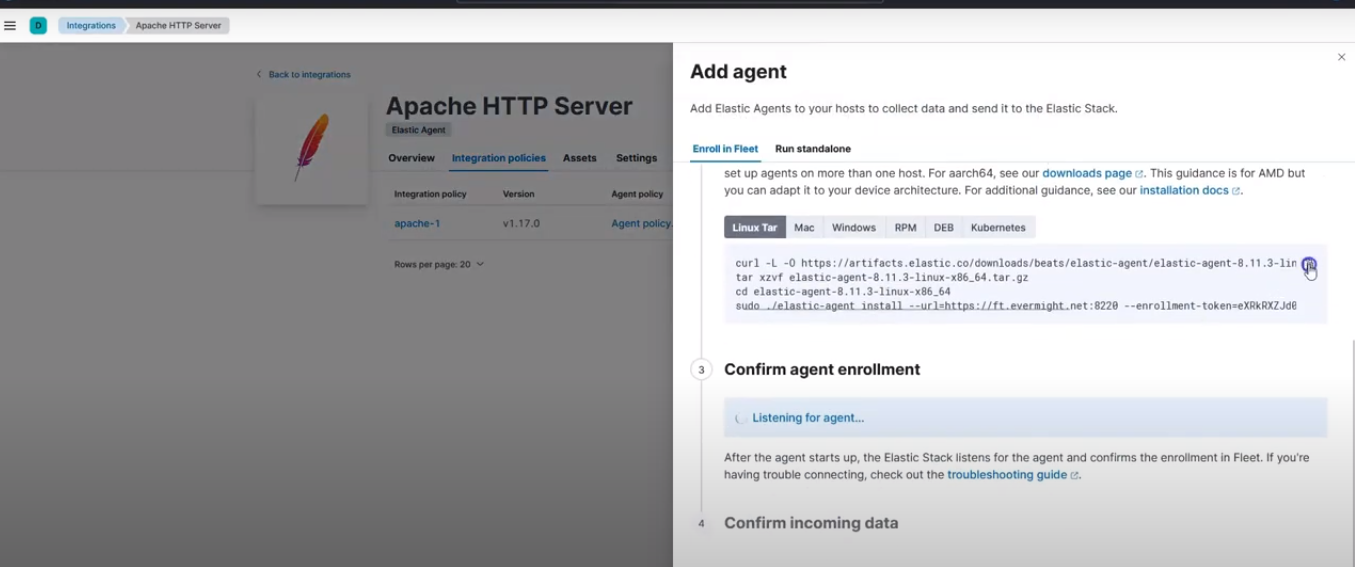 Command to get managed by fleet
Go to the website server terminal, and run this command on the to copy the certificates from the elastic server to the website server
mkdir -p /etc/certs/ca;
cd /etc/certs/ca/;
scp root@es.evermight.net:/etc/elasticsearch/certs/ca/ca.crt ./
Create a file to run the installation
cd ~
vi install-agent.sh
and paste the contents that was copied, and make appropriate edits as shown in the screenshot below:
 Edited command
Then change the permission of the file and run.
chmod 755 install-agent.sh
./install-agent.sh
And enter yes when prompted.
Elastic Agent: Event Logs on Windows [47:50]
Open a bash like terminal on the windows machine/server, and copy the certificate file
mkdir certs
cd certs
scp root@es.evermight.net:/etc/elasticsearch/certs/ca/ca.crt ./
Go to your windows search bar, and search for Event Viewer and run as administrator as shown in the screenshot below:
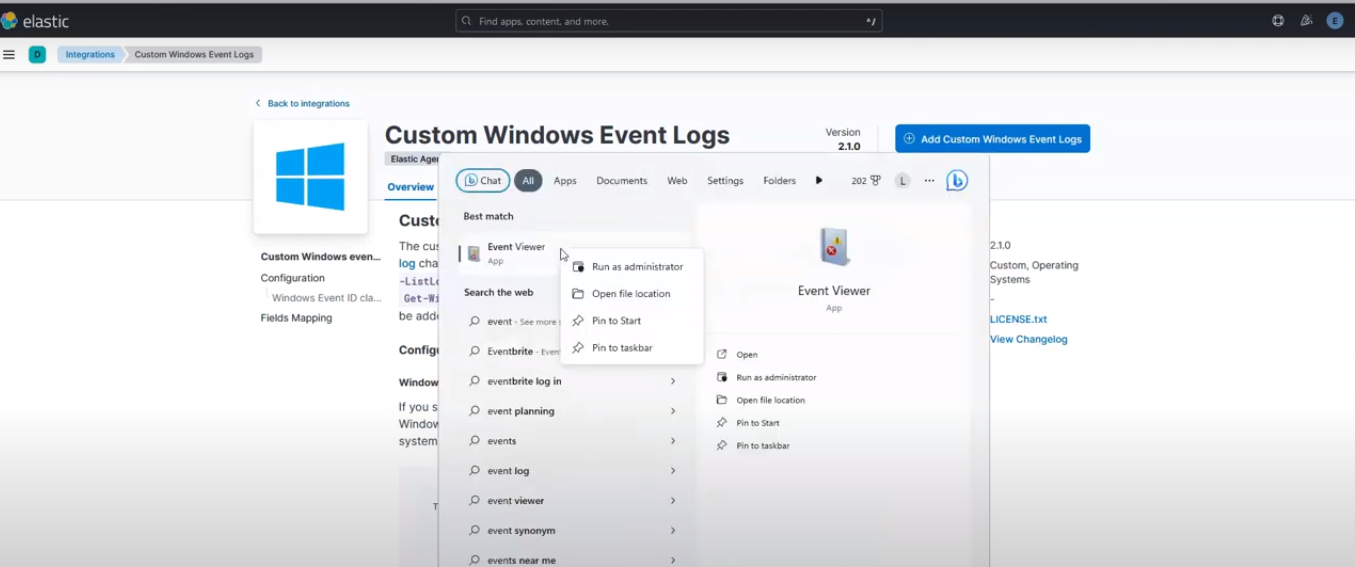 Run Event viewer as administrator
When it opens up, go to Applications and Services Logs > Microsoft > WMI-Activity > Operational.
On Kibana, go to Integrations > Browse Integrations, and search for windows, and click the result as shown in the screenshot below:
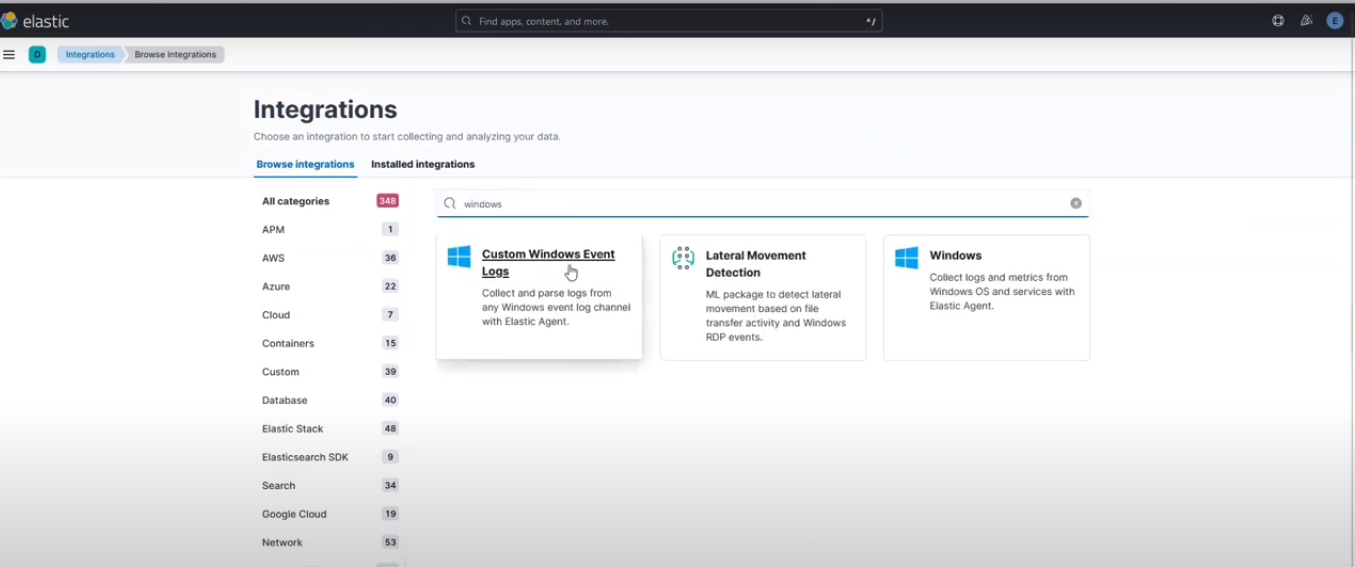 Custom Windows Events Log Search
Click on Add Custom Windows Events Log by the top right corner.
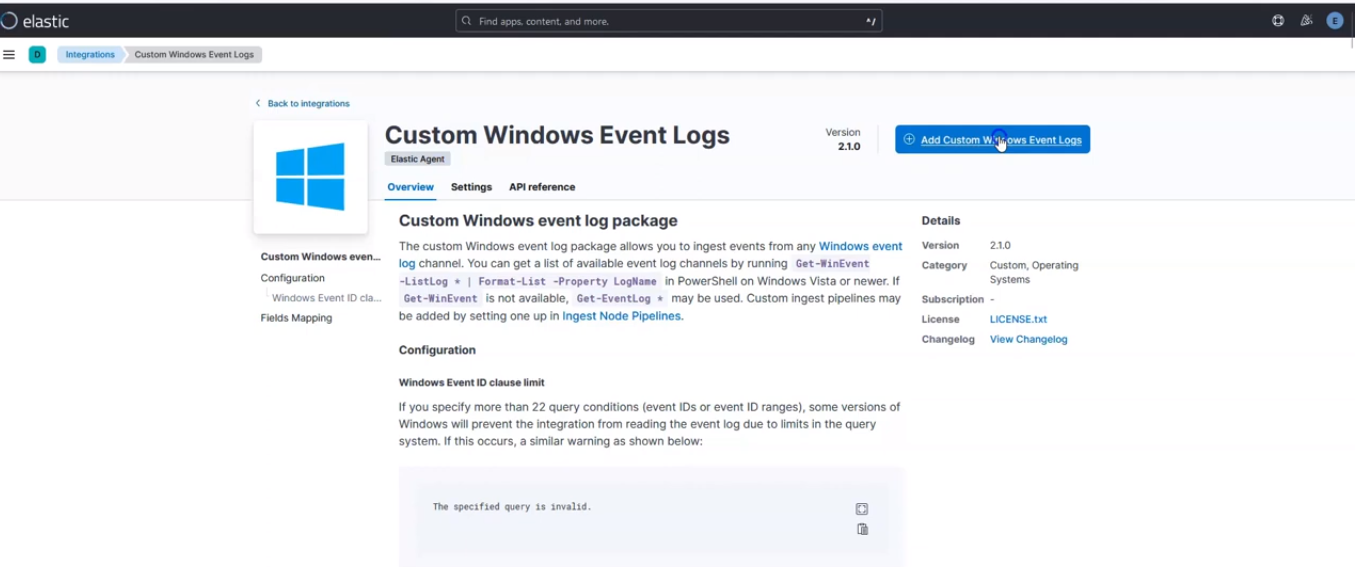 Add Custom Windows Events Log
Go back to the Event Viewer app on your windows machine, and copy the Log name as shown in the screenshot below, and paste it into the Custom Windows Events Logs section on your kibana page.
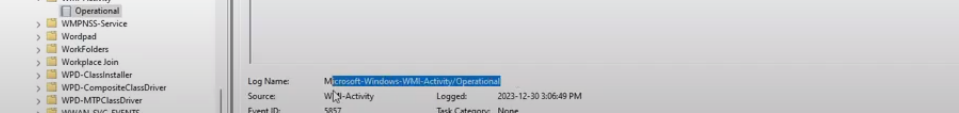
Copy Event viewer Log name
On the Where to add this integration section, under New hosts, click on Advanced options.
Scroll down to Output for integrations and change from default to logstash. Scroll down to Output for agent monitoring and change from default to logstash.
Then click on save and continue, then select Add Elastic Agent to your hosts.
Then copy the command to let it be managed by the fleet server. as shown in the screenshot below:
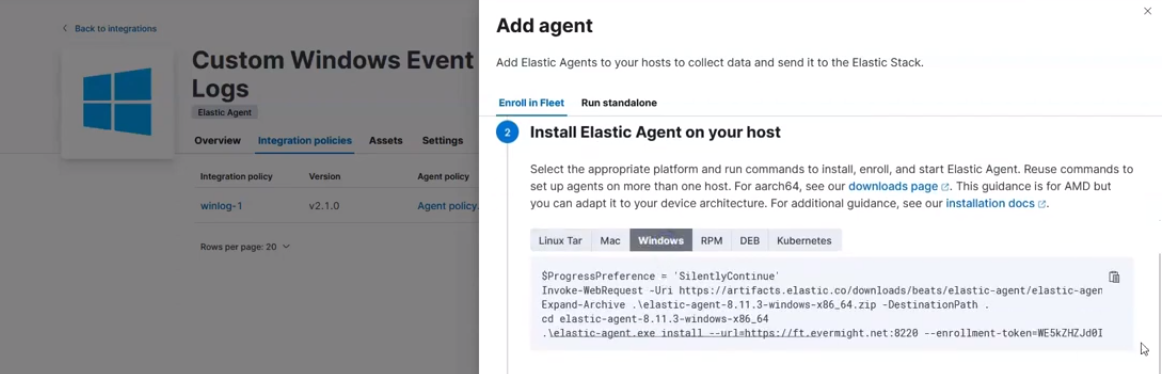 Command for Windows Event Log to get managed by fleet
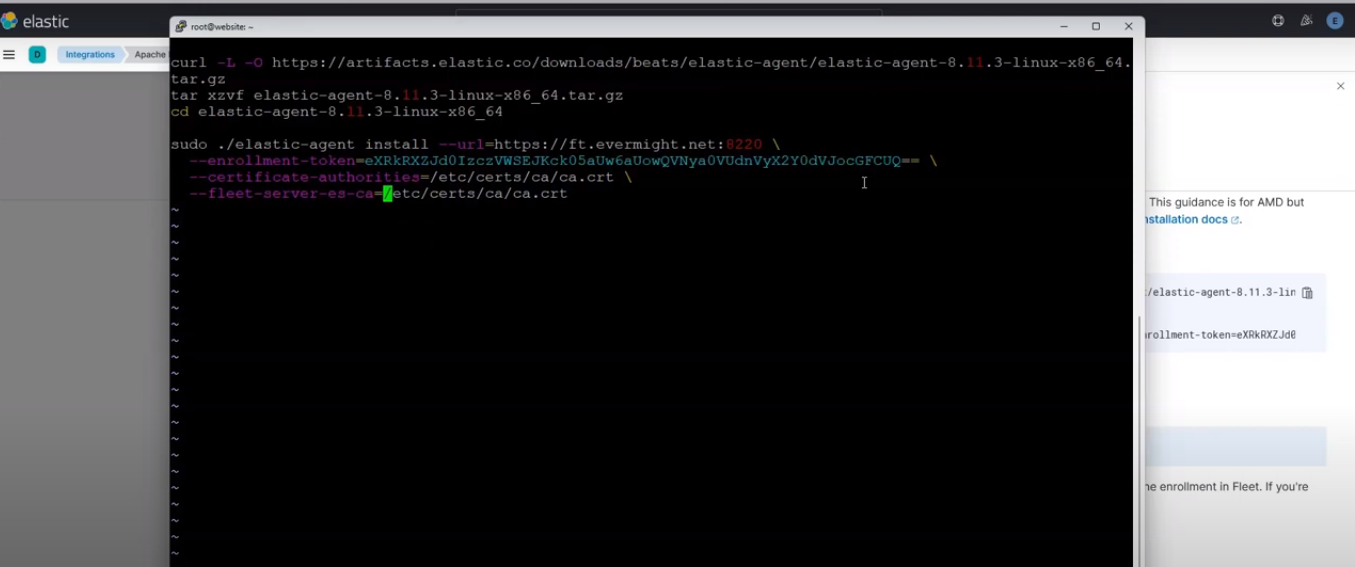
Go to a text editor on your windows machine, and edit the copied command as shown in the screenshot below:
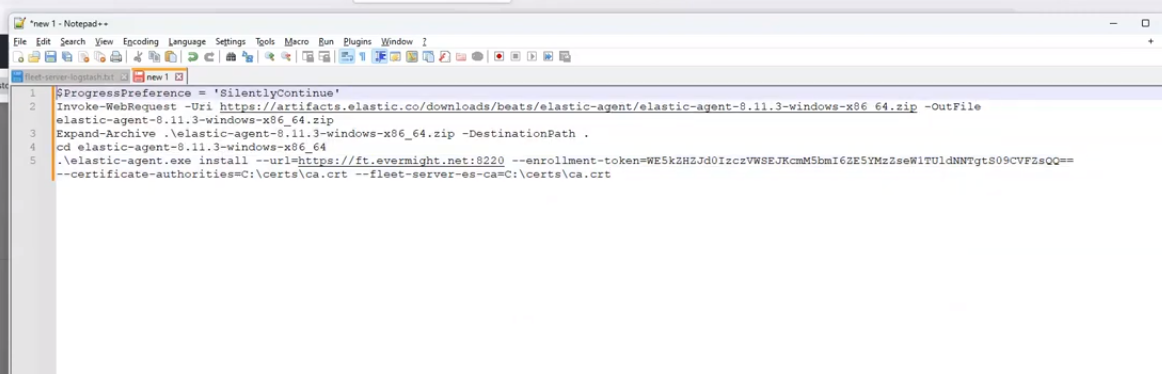 Edited command
Open and run Powershell as administrator, then paste the command and run. Enter yes when prompted.