
Introduction
Code on Github: Elasticsearch Data Enrichment
If you do not have Elasticsearch and Kibana set up yet, then follow these instructions.
This video assumes you are using Publicly Signed Certificates. If you are using Self Signed Certificates, go here TBD.
Requirements
- A running instance of Elasticsearch and Kibana.
- An instance of another Ubuntu 20.04 server running any kind of service.
Process
Install Logstash [09:20]
Open your terminal. Go to this GitHub Repo, and clone the repo with the following commands:
git init
git remote add origin https://github.com/evermight/elasticsearch-ingest.git
git pull origin master
cd part-3
Install Logstash with this commands:
wget -qO - https://artifacts.elastic.co/GPG-KEY-elasticsearch | sudo gpg --dearmor -o /usr/share/keyrings/elasticsearch-keyring.gpg
sudo apt-get install -y apt-transport-https
echo 'deb [signed-by=/usr/share/keyrings/elasticsearch-keyring.gpg] https://artifacts.elastic.co/packages/8.x/apt stable main' | sudo tee /etc/apt/sources.list.d/elastic-8.x.list
sudo apt-get update && sudo apt-get install -y logstash
setup the environment variables with these command:
cp env.sample.env .env
vi.env
Now make changes accordingly
PROJECTPATH="/absolute/path/to/current/directory"
ELASTICHOST="your.domain.or.ip:9200"
ELASTICSSL="use only the string true or the string false"
ELASTICUSER="elastic"
ELASTICPASS="<Your Elastic Password>"
Ingest zipgeo.csv (geopoint field type) [11:45]
In the same terminal, now run the below command:
./01-zip_geo.sh
and after some time, it will load the zip_geo.csv file, and create enriched index for it also.
It will use the following:
- logstash contents located at
logstash/zip_geo.conffile. - mapping contents located in the
mapping/zip_geo.jsonfile. - policy contents located in the
policy/zip_geo.jsonfile.
To confirm the index was created, go to Stack Management > Index Management. And you should see a similar result to the image below:
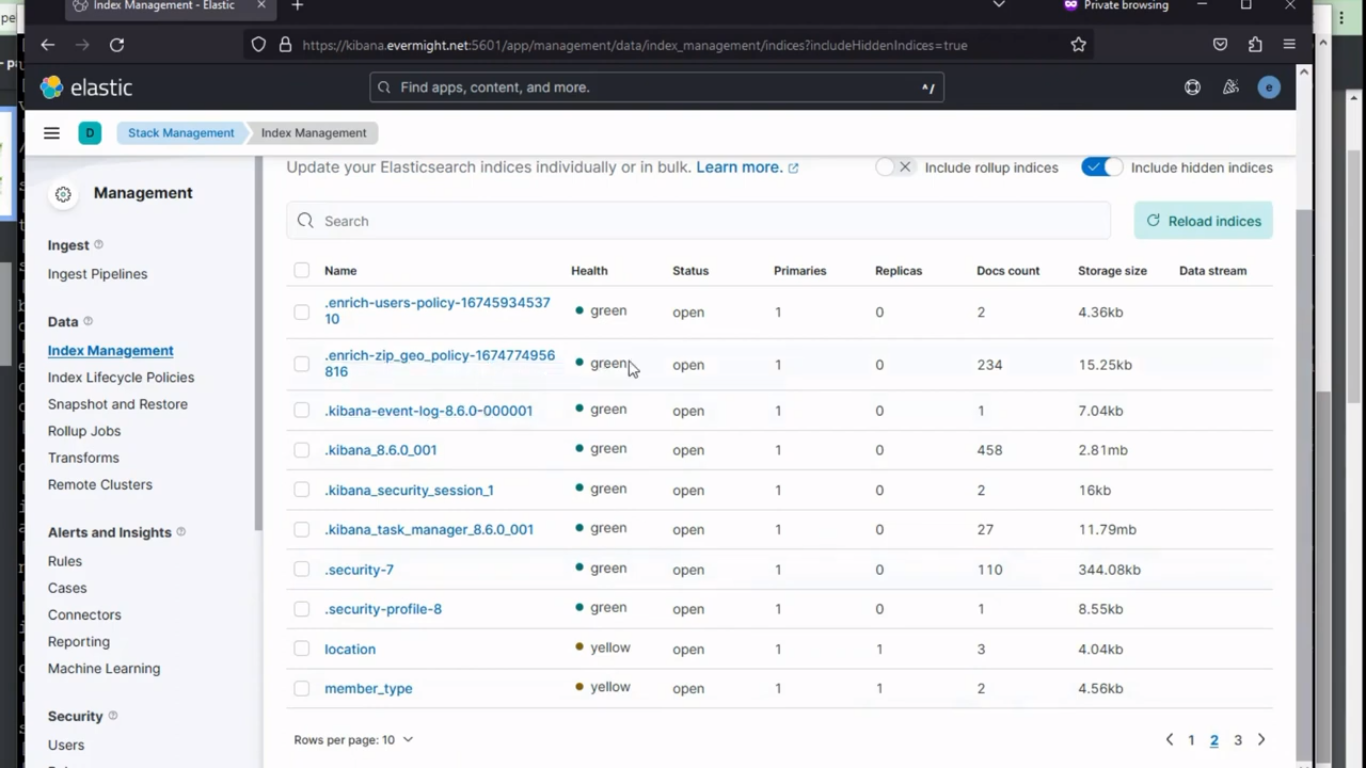 Policy for zip geo
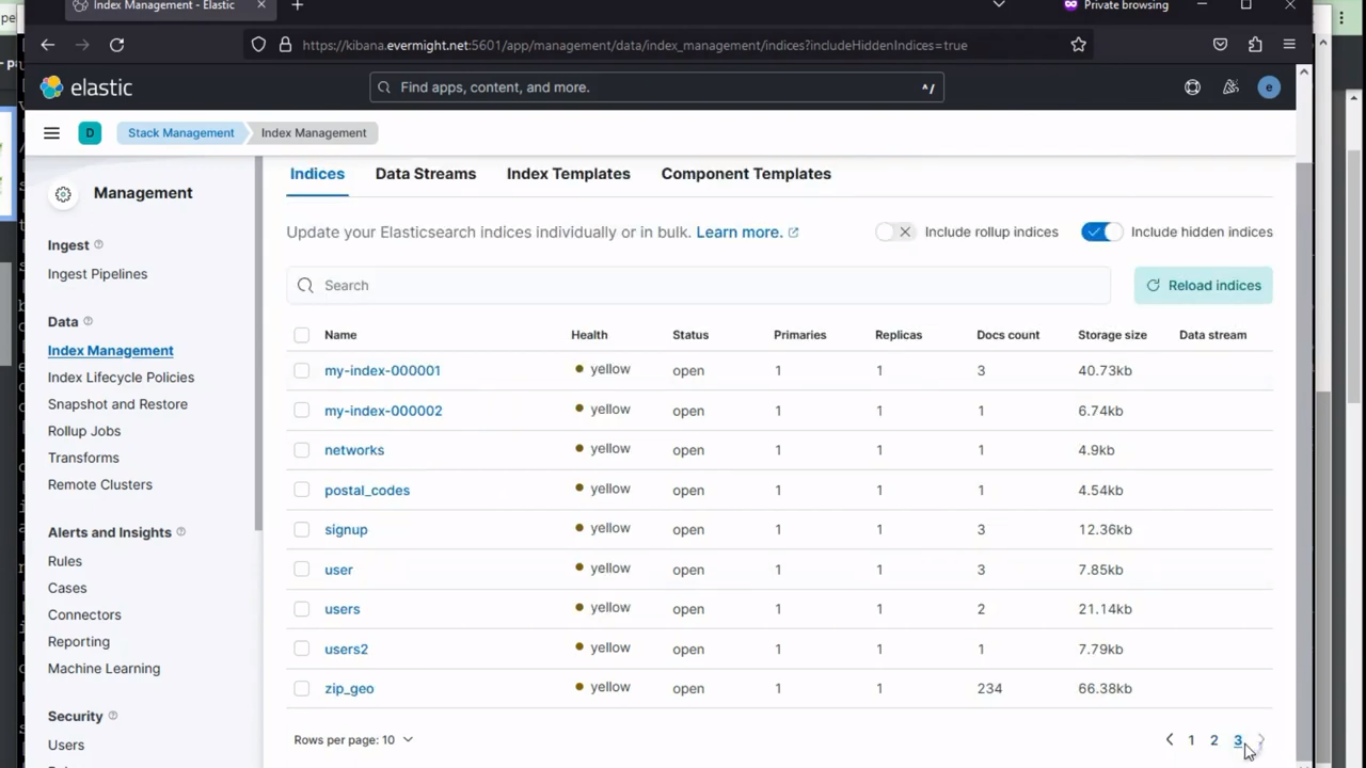 Index for zip geo
Ingest customer.csv [19:55]
Now run the below command for customer.csv file:
./02-customer.sh
And after some time, it will load the customer.csv file, and create enriched index for it also.
It will use the following:
- logstash contents located at
logstash/customer.conffile. - mapping contents located in the
mapping/customer.jsonfile. - policy contents located in the
policy/customer.jsonfile. - pipeline contents located at
pipeline/customer.jsonfile.
To confirm the index was created, go to Stack Management > Index Management. And you should see a similar result to the image below:
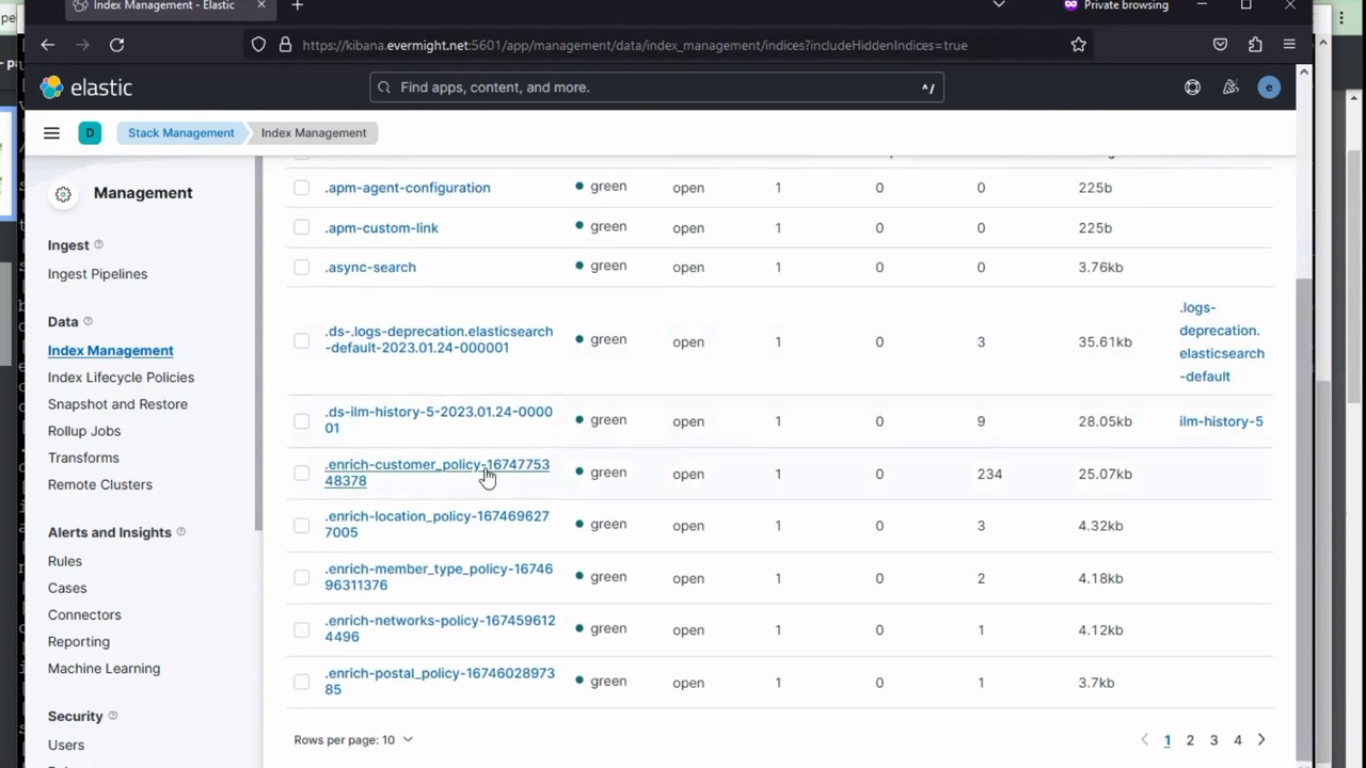 Policy for customer
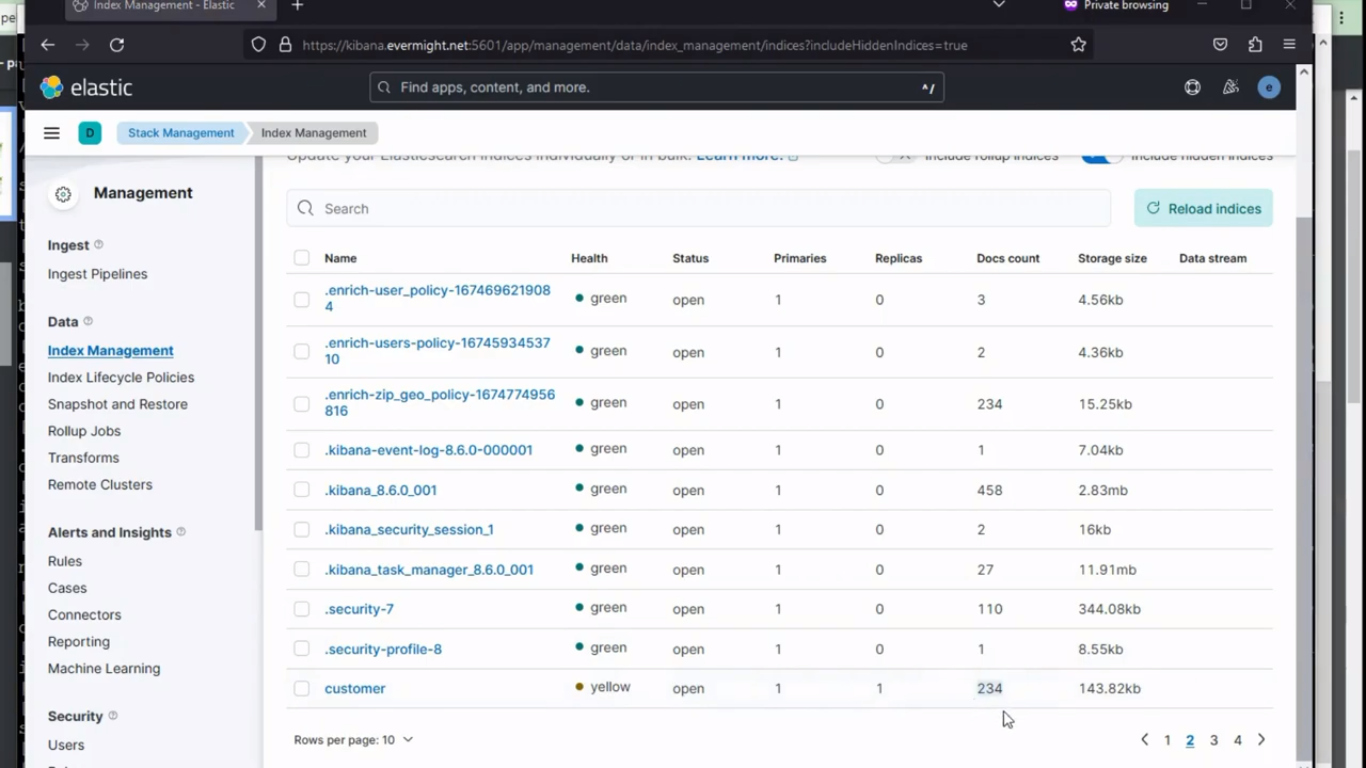 Index for customer
Ingest product.csv [23:57]
Now run the below command for product.csv file:
./03-product.sh
And after some time, it will load the product.csv file, and create enriched index for it also.
It will use the following:
- logstash contents located at
logstash/product.conffile. - policy contents located in the
policy/product.jsonfile.
To confirm the index was created, go to Stack Management > Index Management. And you should see a similar result to the image below:
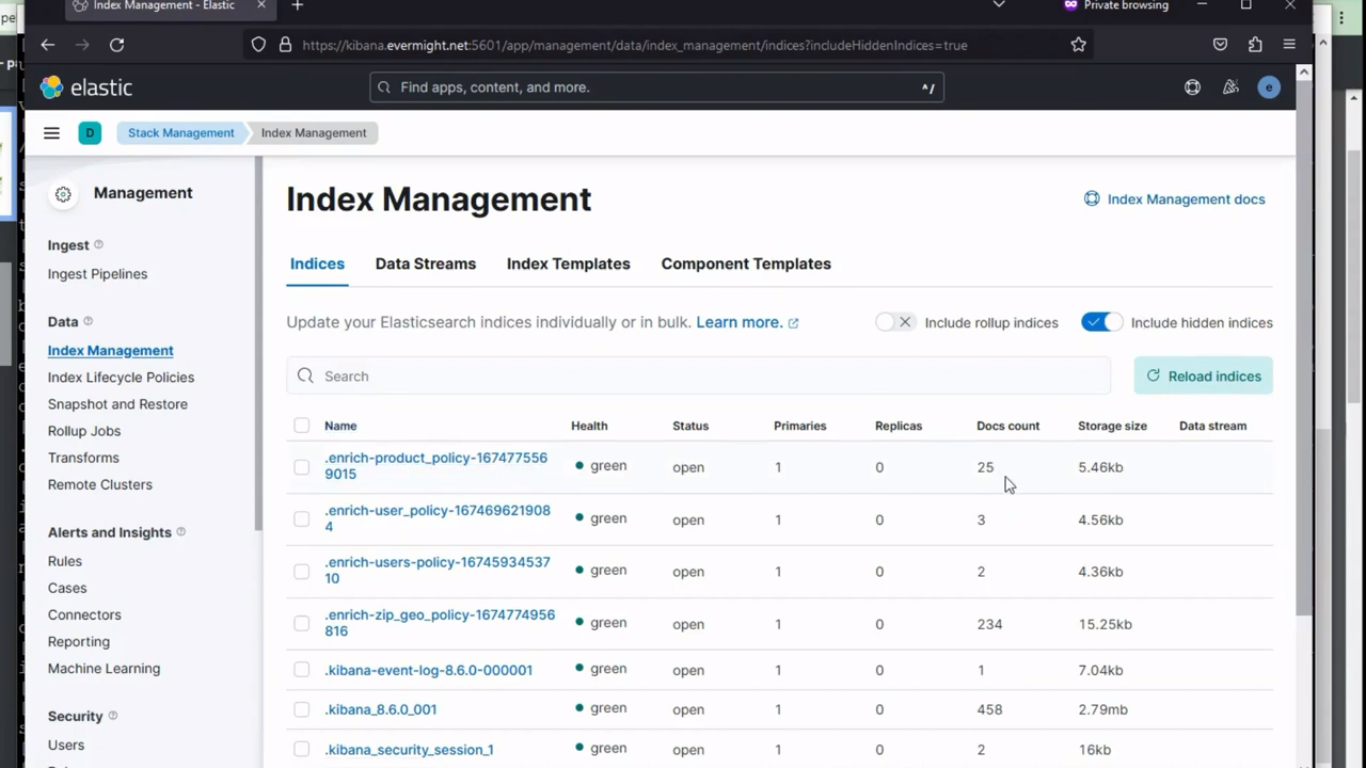 Policy for product
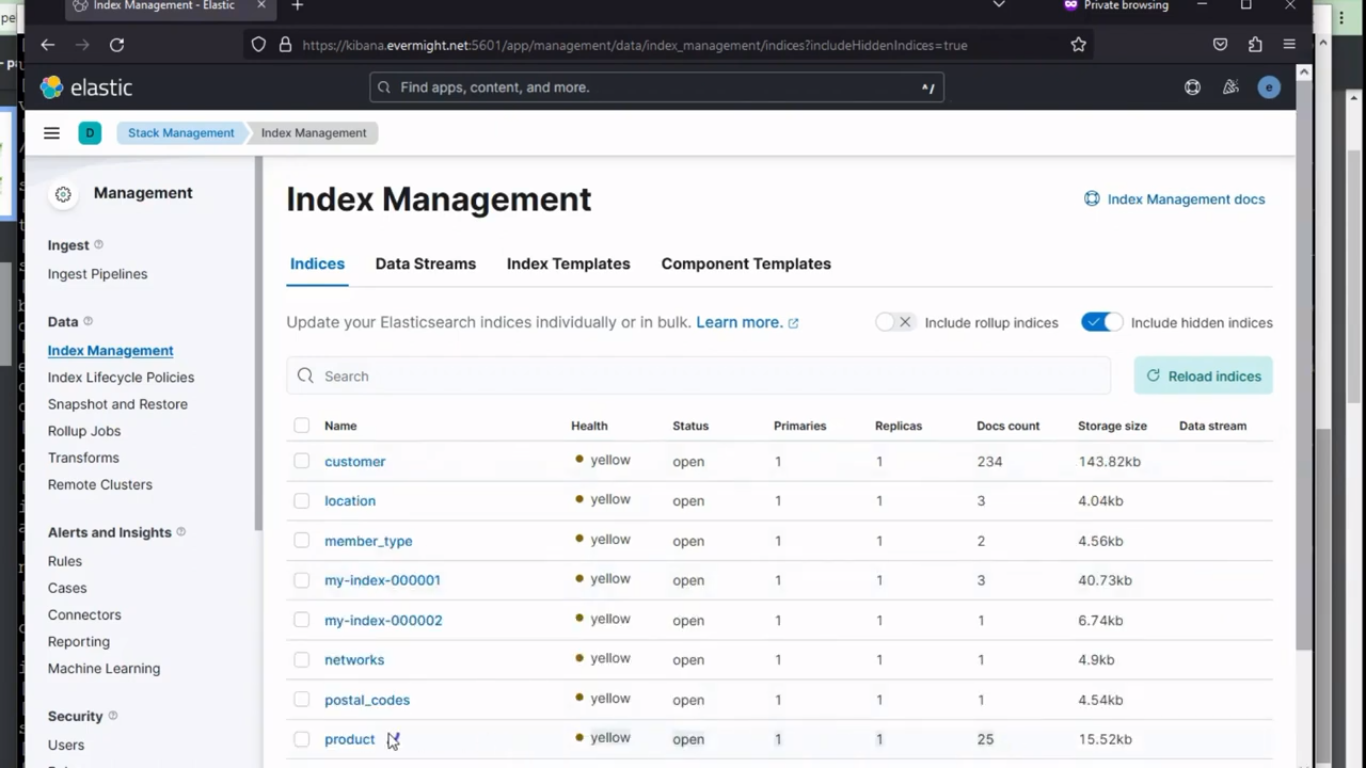 Index for product
Ingest order_item.csv [26:00]
Now run the below command for order_item.csv file:
./04-order_item.sh
And after some time, it will load the order_item.csv file, and create enriched index for it also.
It will use the following:
- logstash contents located at
logstash/order_item.conffile. - policy contents located in the
policy/order_item.jsonfile. - pipeline contents located at
pipeline/order_item.jsonfile.
To confirm the index was created, go to Stack Management > Index Management. And you should see a similar result to the image below:
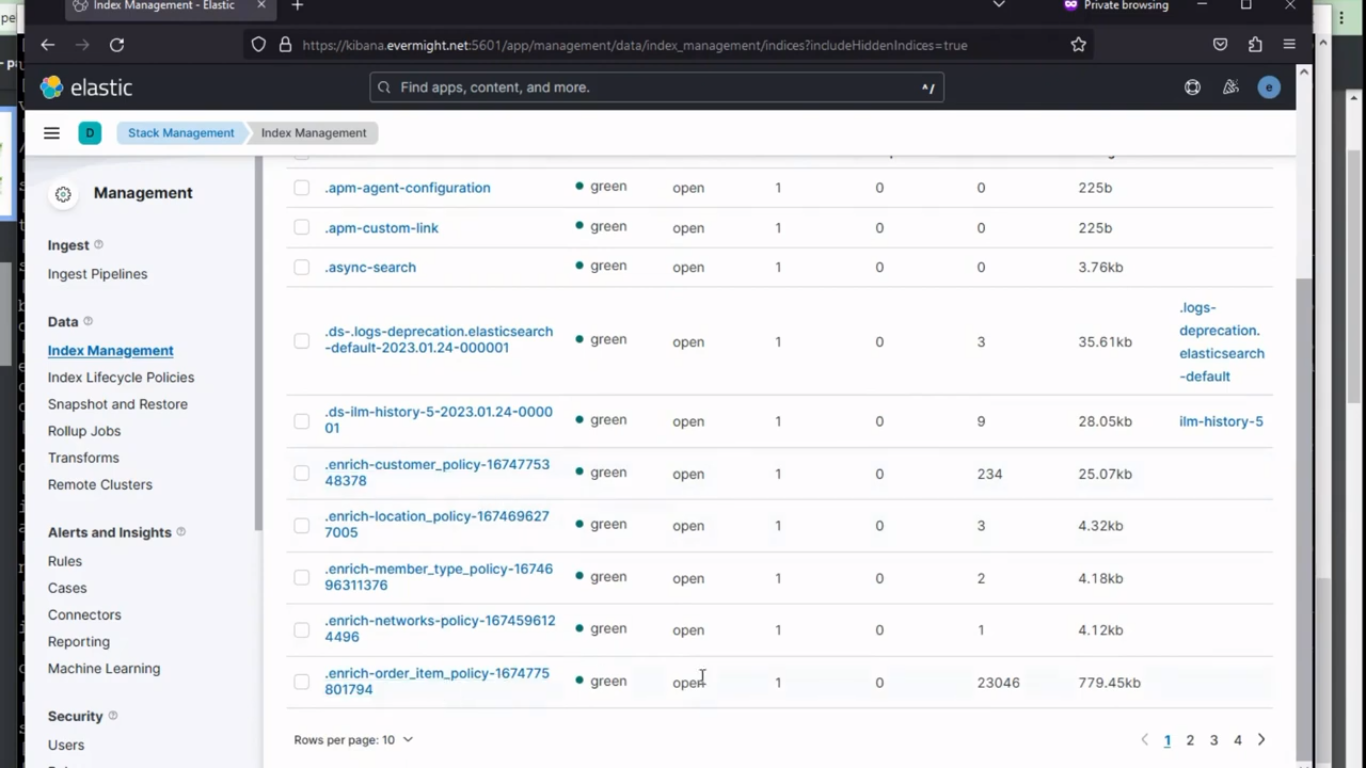 Policy for order item
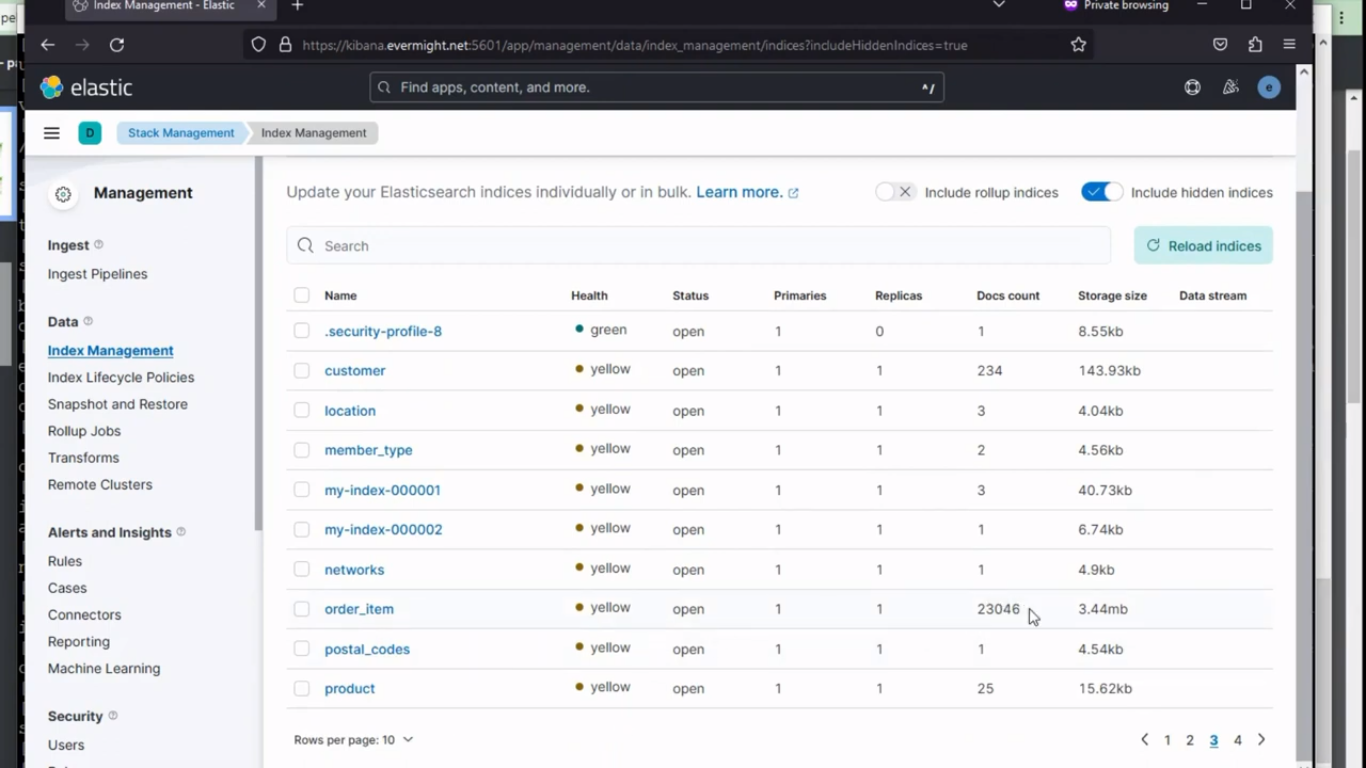 Index for order item
Ingest order.csv [27:44]
Now run the below command for order.csv file:
./05-order.sh
And after some time, it will load the order.csv file, and create enriched index for it also.
It will use the following:
- logstash contents located at
logstash/order.conffile. - mapping contents located in the
mapping/order.jsonfile. - pipeline contents located at
pipeline/order.jsonfile.
To confirm the index was created, go to Stack Management > Index Management. And you should see a similar result to the image below:
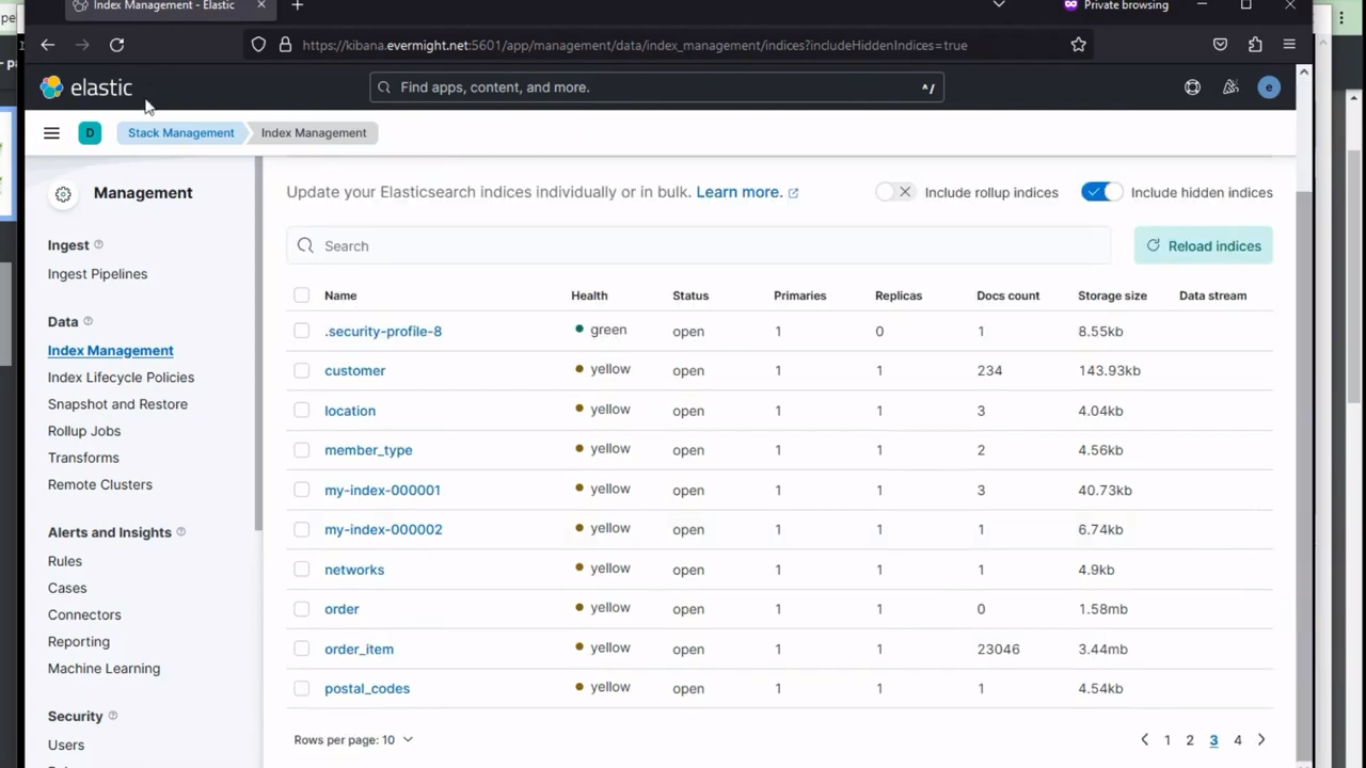 Index for order
Ease of running
Run the below command to destroy all the previous resource created
./teardown.sh
And if you want to run all the .sh script at once, you can use the below command instead, and it will run all the script in the correct order they were meant to be executed;
./run.sh
Test data with visualization [33:05]
Go to Stack Management > Data Views, and create a new kibana data view as sown in the image below:
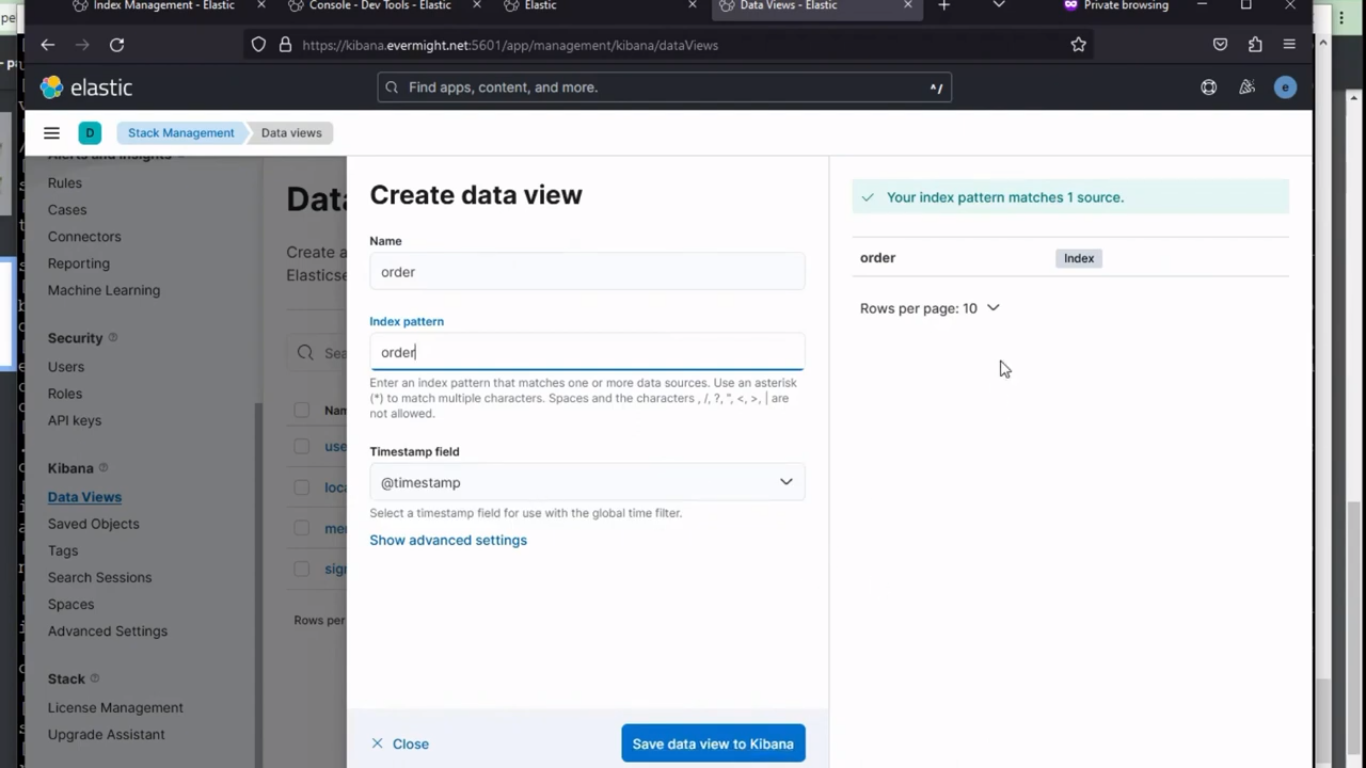 Data view creation
In Kibana, Under Analytics go to Visualize Library and click on Create new visualization, and then choose Maps from the options, and then click on Add Layer, and pick a Heat map, click on data view and choose order.
you should see a result similar to this:
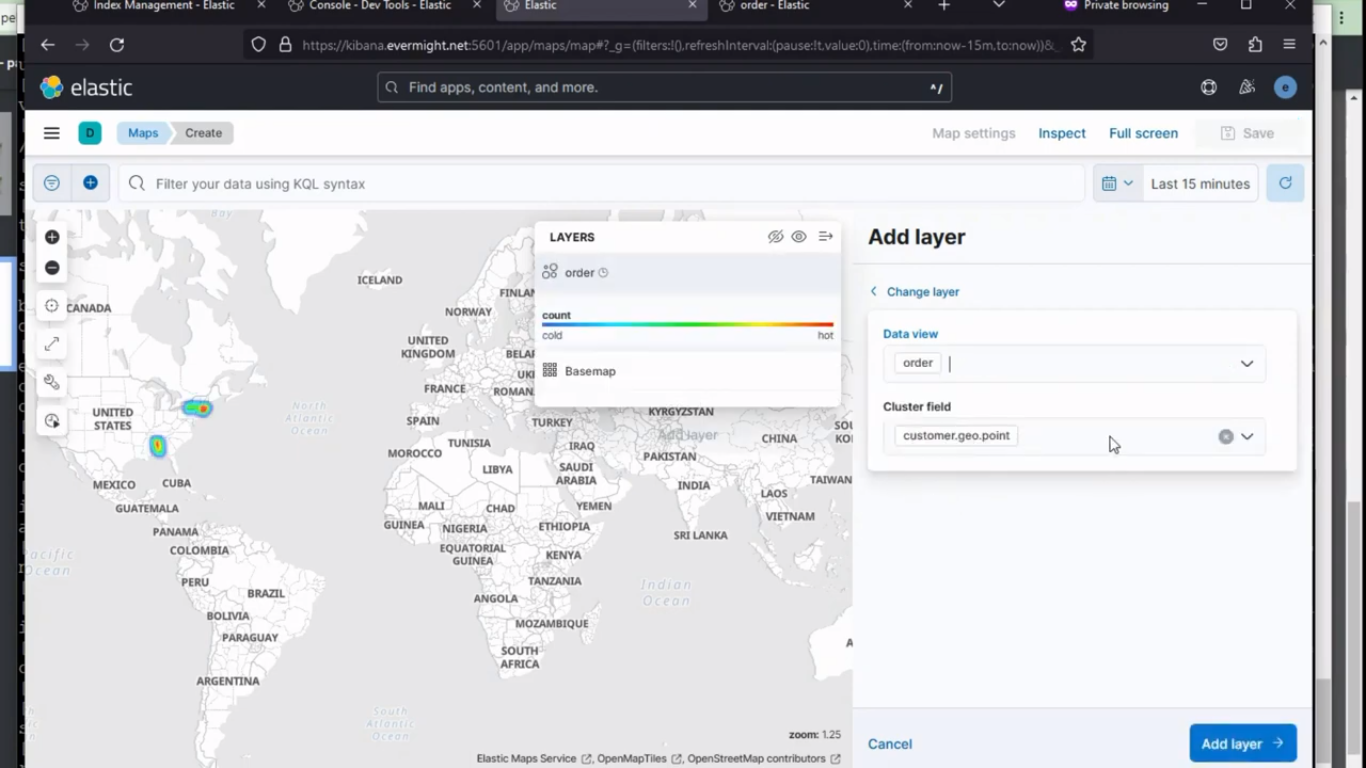 Heat Map selection
and then click on Add layer.
Now in the metrics field, select the following:
Aggregation: Sum
Field: order_items.product.price
Now save the Map, by clicking on Save and go to Dashboard
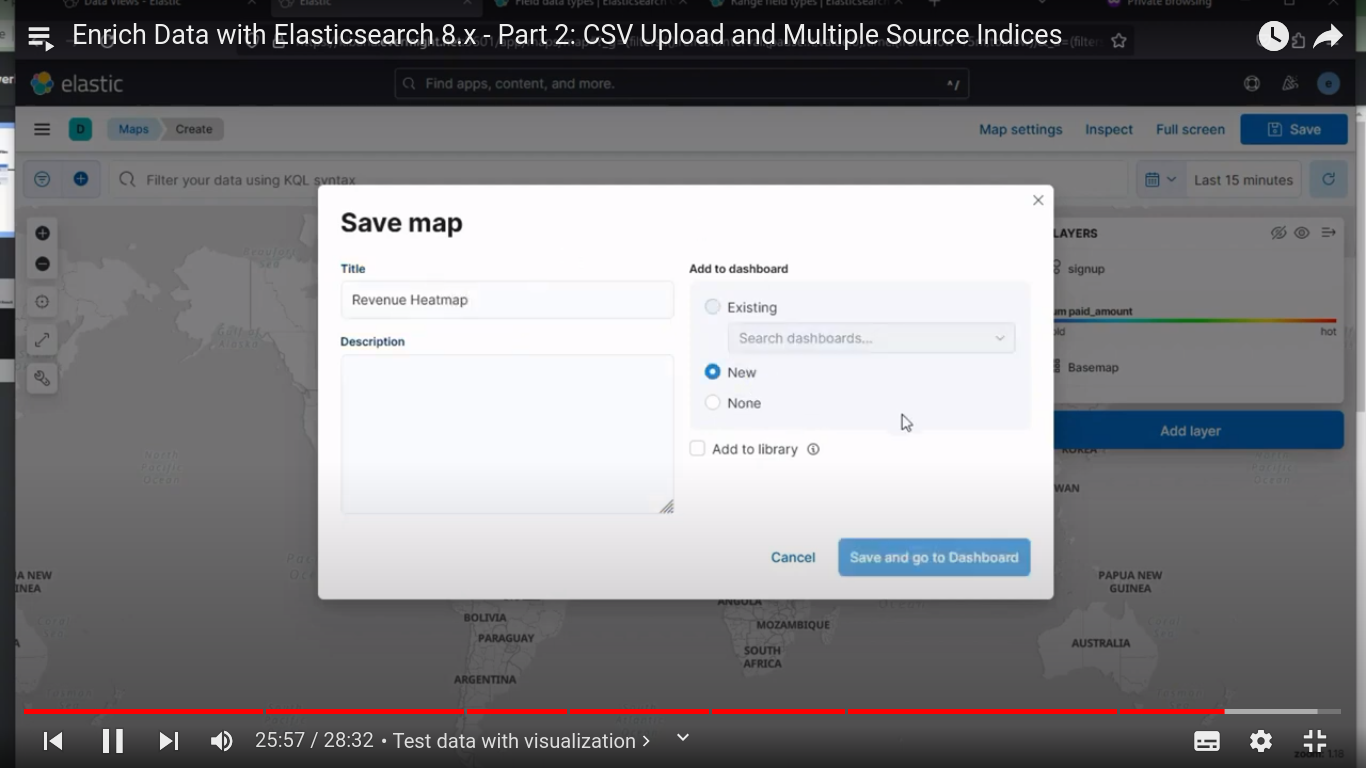 Save the heat map
Save the Dashboard as Revenue by Region Part 3, existing dashboard Demo Dashboard.
Create a second Visualization on order data while dragging and dropping the required metrics from the left to the right horizontal axiz, and choose sum on the vertical axis as shown in the image below:
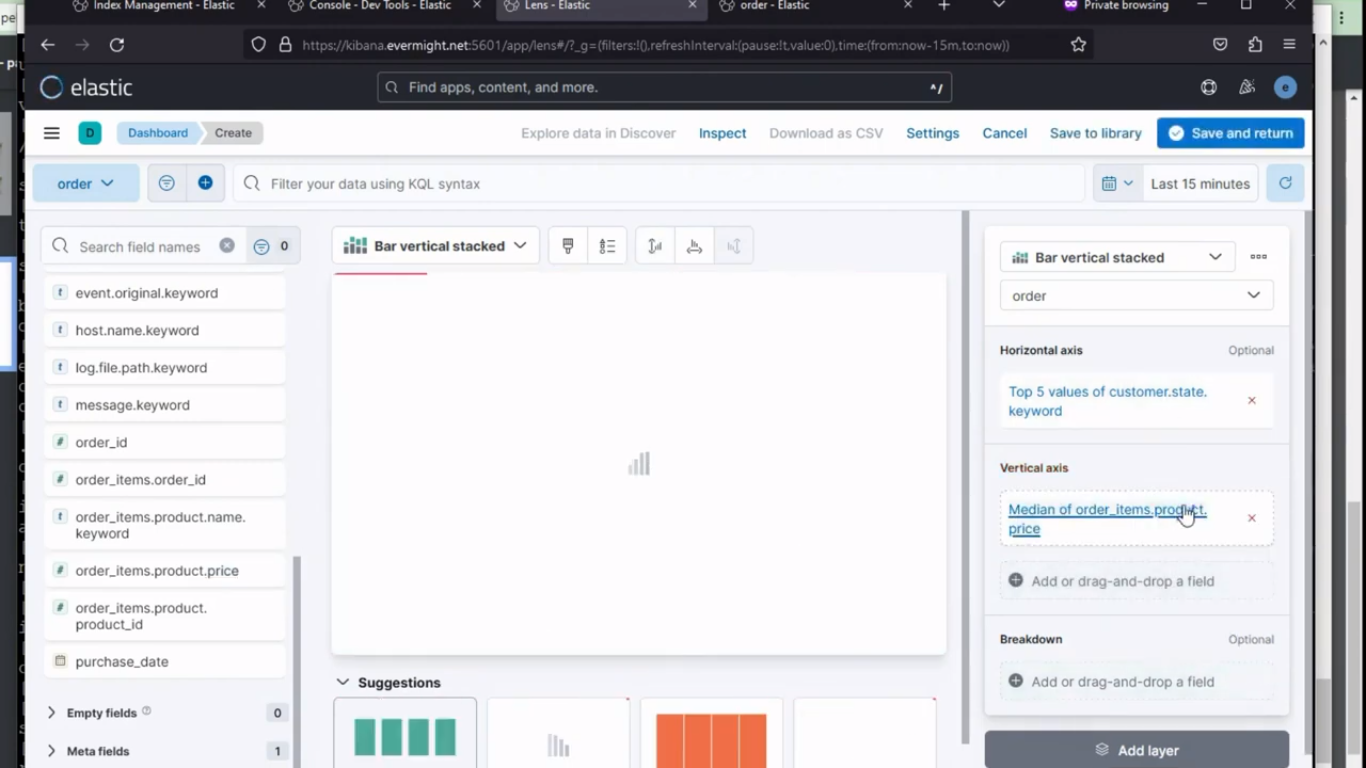 2nd visualization
Then click on Save and return.
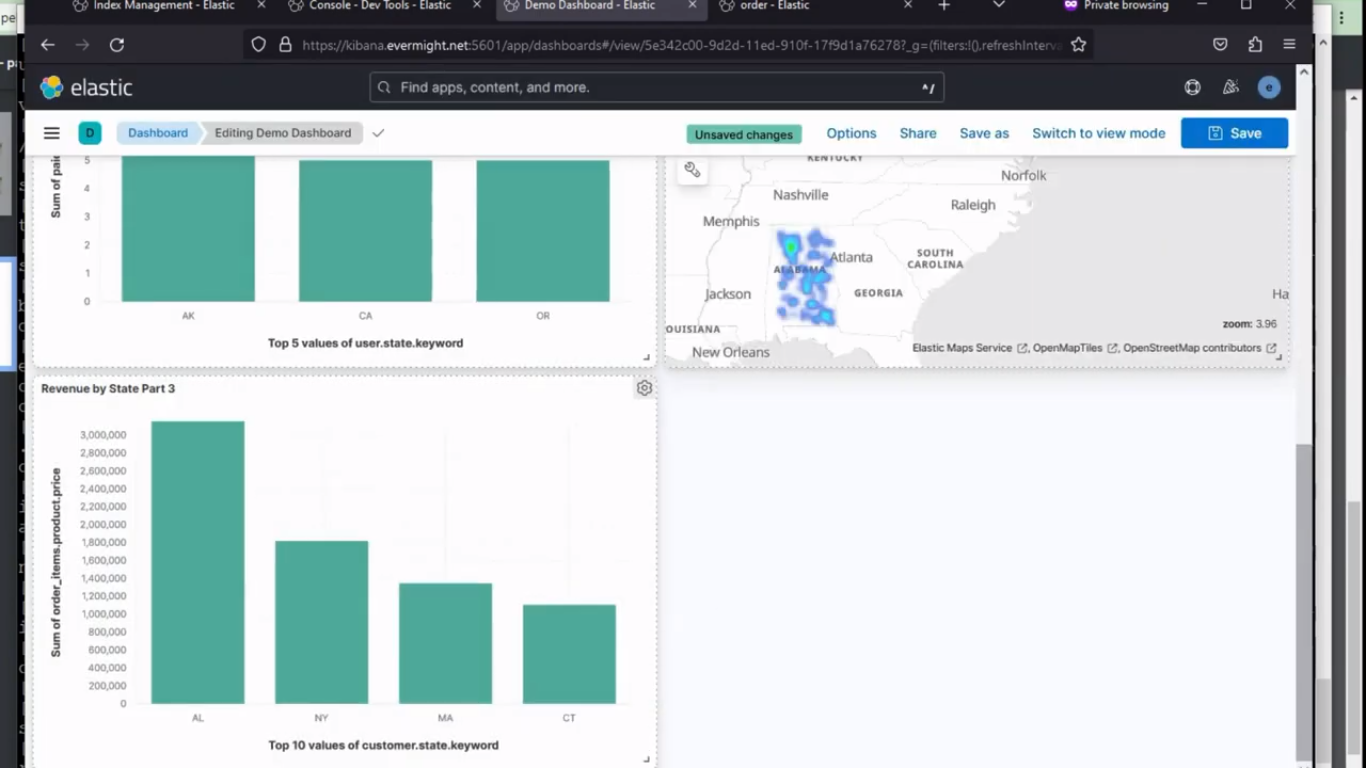 All two visualization
