
Introduction
Code on Github: Elasticsearch Data Enrichment
If you do not have Elasticsearch and Kibana set up yet, then follow these instructions.
This video assumes you are using Publicly Signed Certificates. If you are using Self Signed Certificates, go here TBD.
Requirements
- A running instance of Elasticsearch and Kibana.
- An instance of another Ubuntu 20.04 server running any kind of service.
Process
Ingest user.csv file [05:15]
In Kibana, go to Machine Learning > Data Visualizer. We will do our upload of data using it, as shown in the image below:
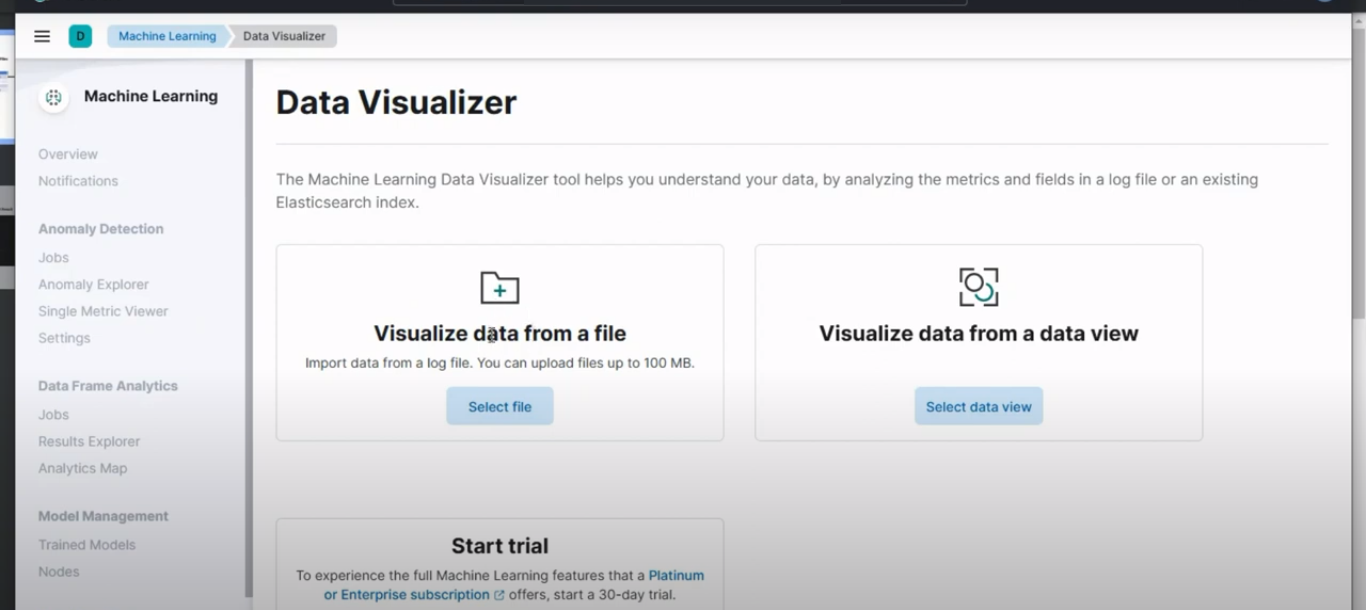 Upload data
And then upload the user.csv file data. Give it an index name of user, and then click on import.
To confirm the index was created, go to Stack Management > Index Management. And you should see a similar result to the image below:
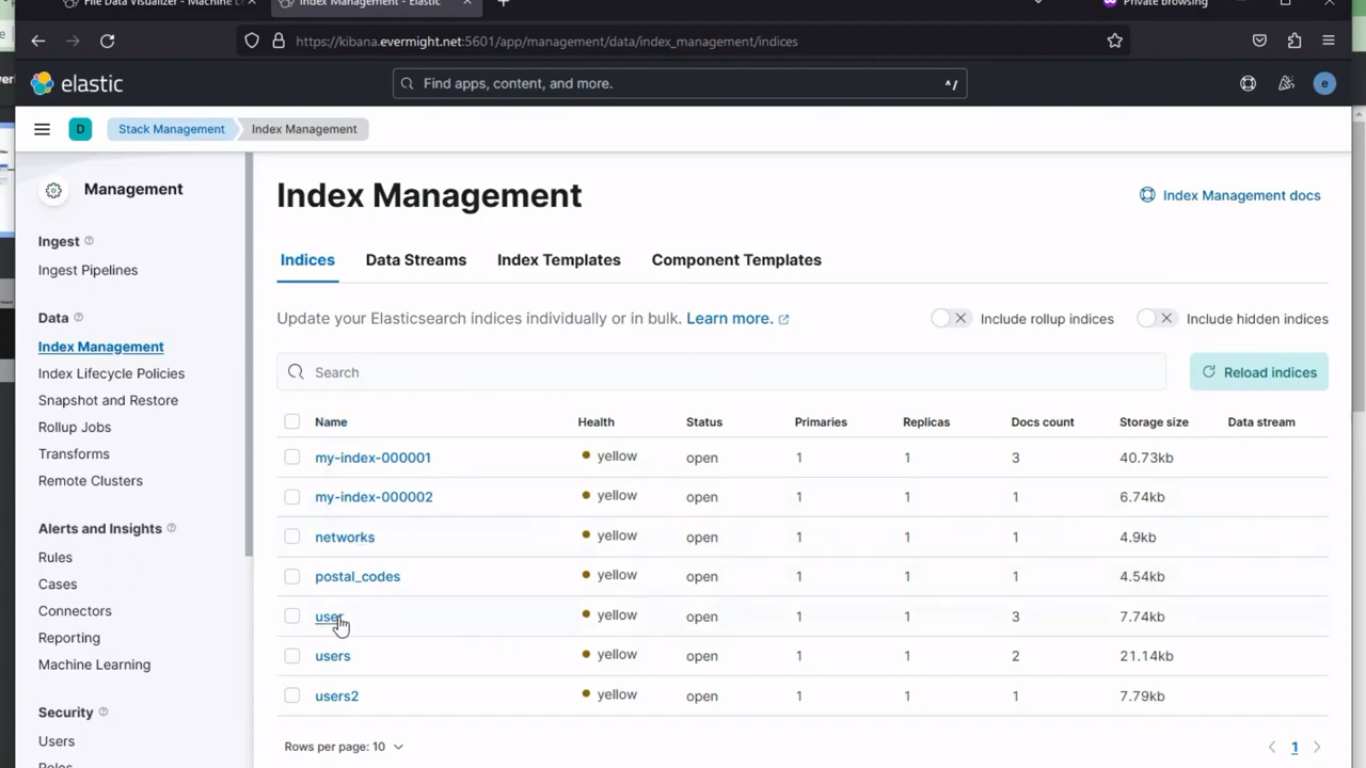 Index created succesfully
To view the data, go to Dev Tools > Console in Kibana. and do a search with the below command:
GET user/_search
and you should see a result similar to this:
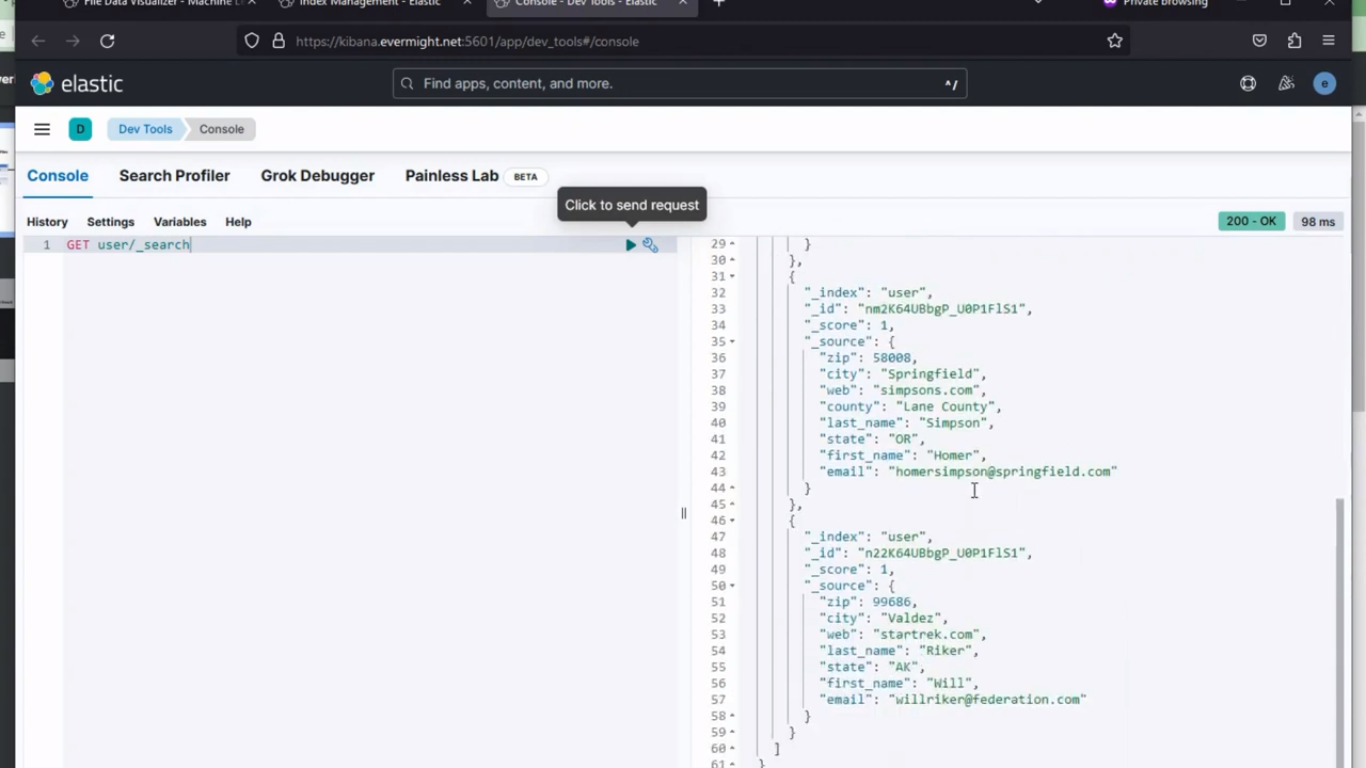 Quereyed data
Ingest location.csv (geo_point field type) [09:35]
In Kibana, go to Machine Learning > Data Visualizer. And then upload the location.csv file data. Give it an index name of location, and then change the point > type from keyword.
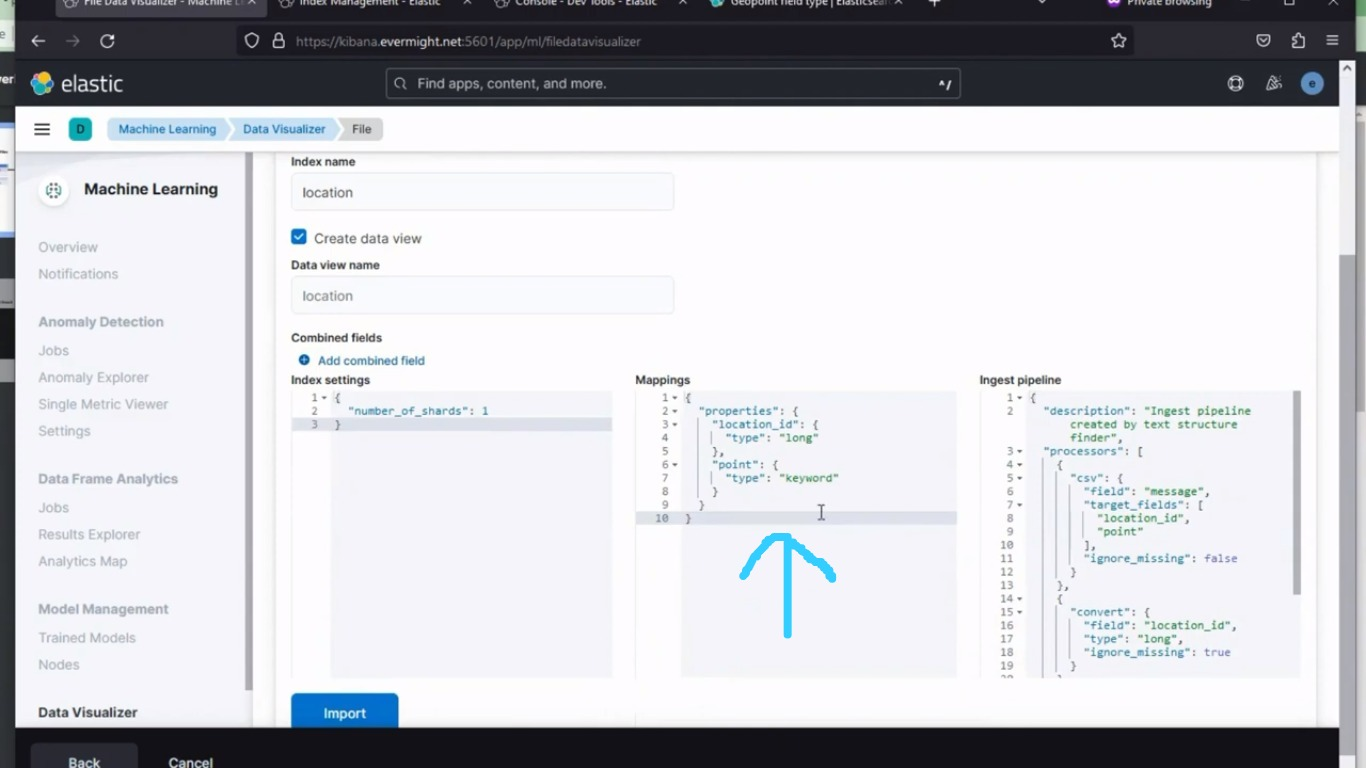 Mappings change: Before
To geo_point, as shown in the image below:
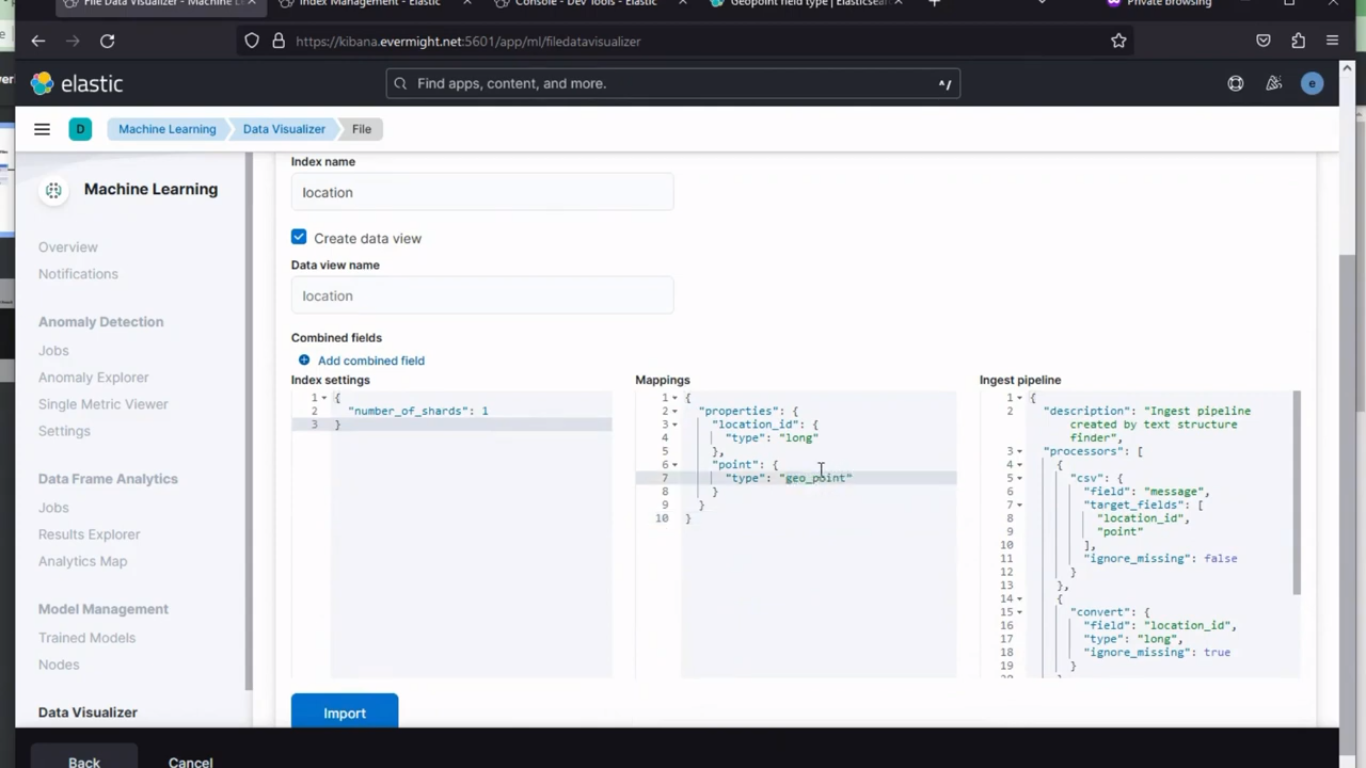 Mappings change: After
and then click on import.
To confirm the index was created, go to Stack Management > Index Management. And you should see a similar result to the image below:
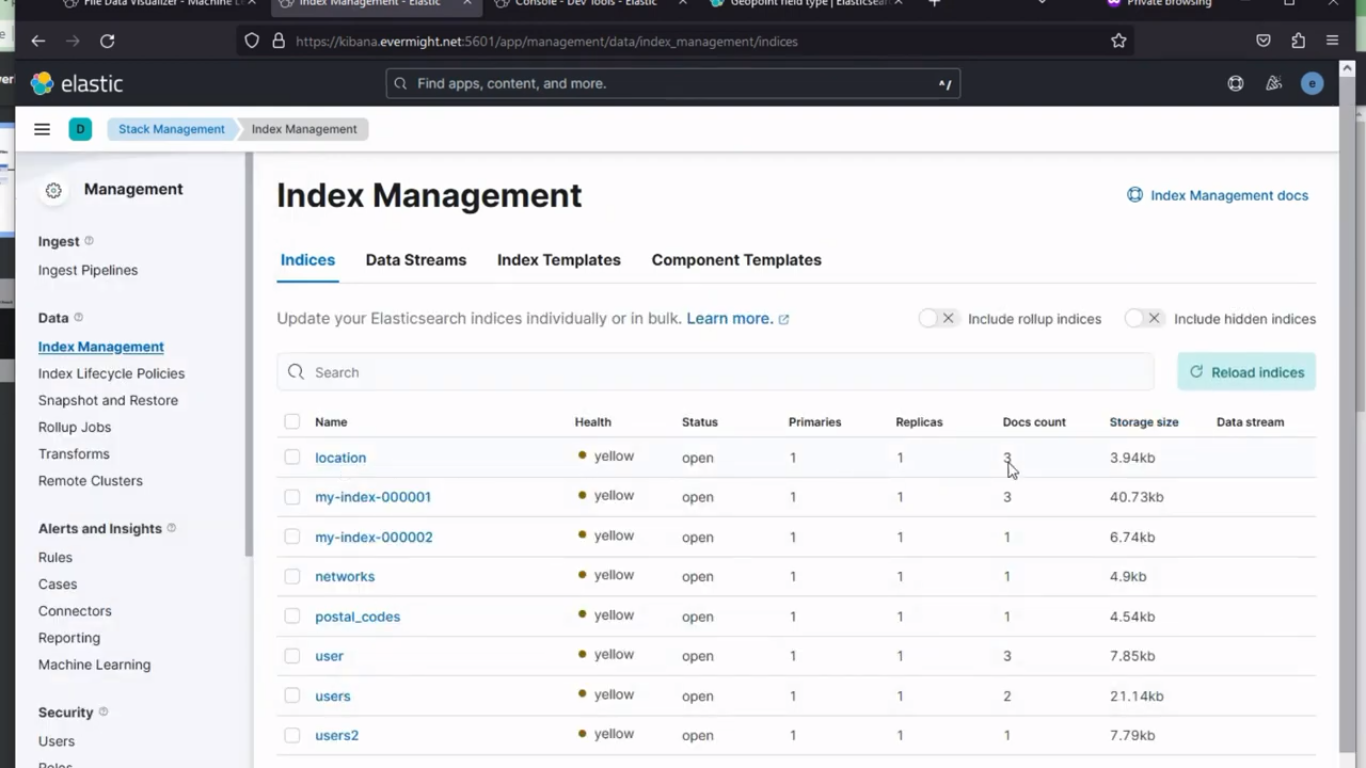 Index created succesfully
To view the data, go to Dev Tools > Console in Kibana. and do a search with the below command:
GET location/_search
and you should see a result similar to this:
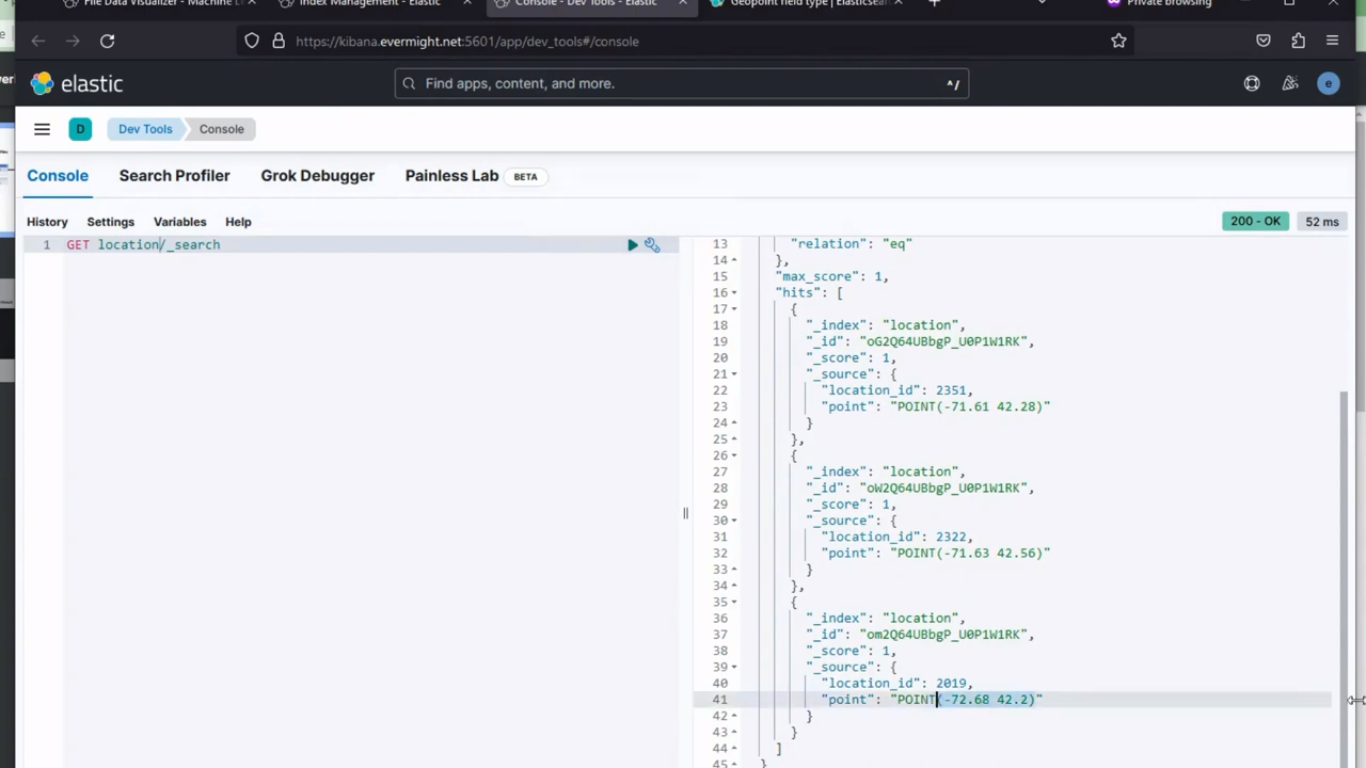 Quereyed data
Ingest member_ type.csv (integer_range field type) [11:47]
In Kibana, go to Machine Learning > Data Visualizer. And then upload the member_type.csv file data. Give it an index name of member_type, and then change the price_range > type from keyword.
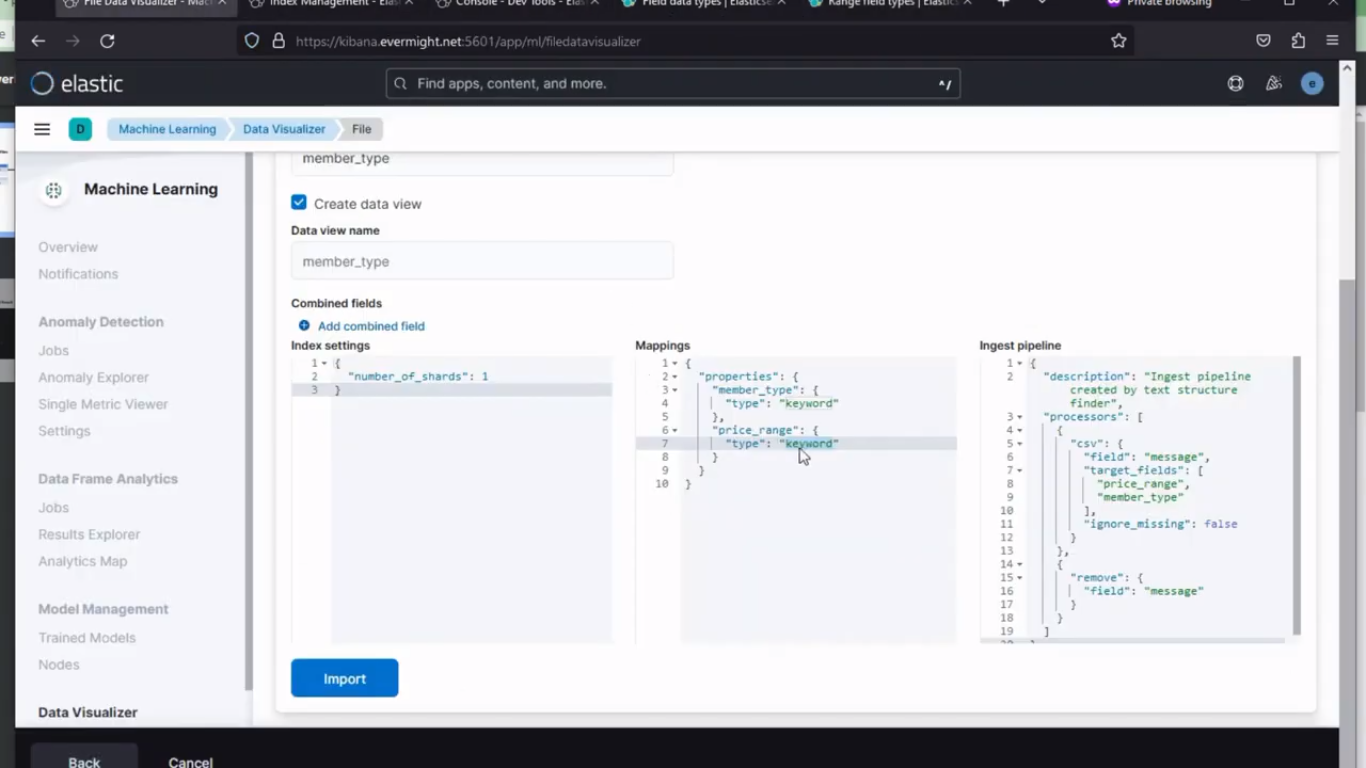 Mappings Change: Before
To integer_range, and also add the following into the pipeline section
{
  "json" : {
    "field" : "price_range"
  }
},
as shown in the image below:
 Mappings change: After
and then click on import.
To confirm the index was created, go to Stack Management > Index Management. And you should see a similar result to the image below:
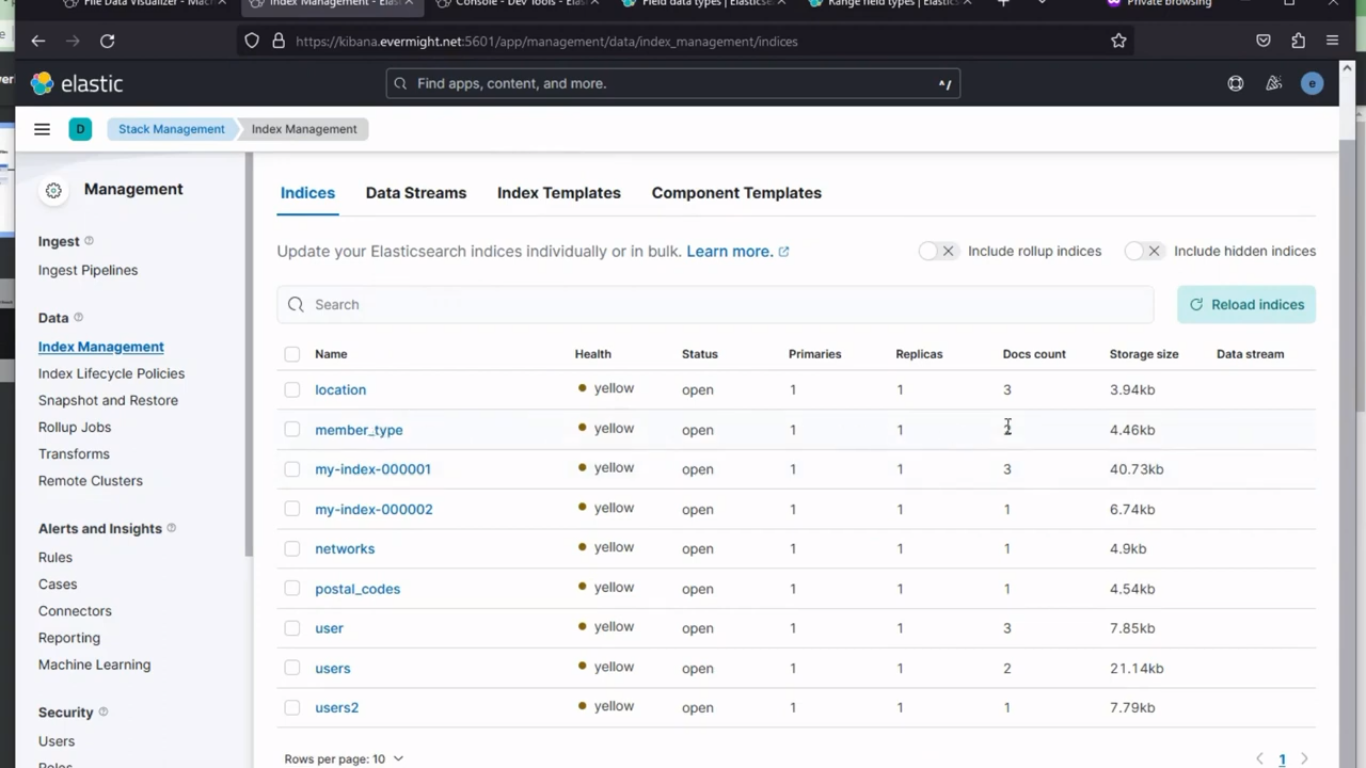 Index created succesfully
To view the data, go to Dev Tools > Console in Kibana. and do a search with the below command:
GET member_type/_search
and you should see a result similar to this:
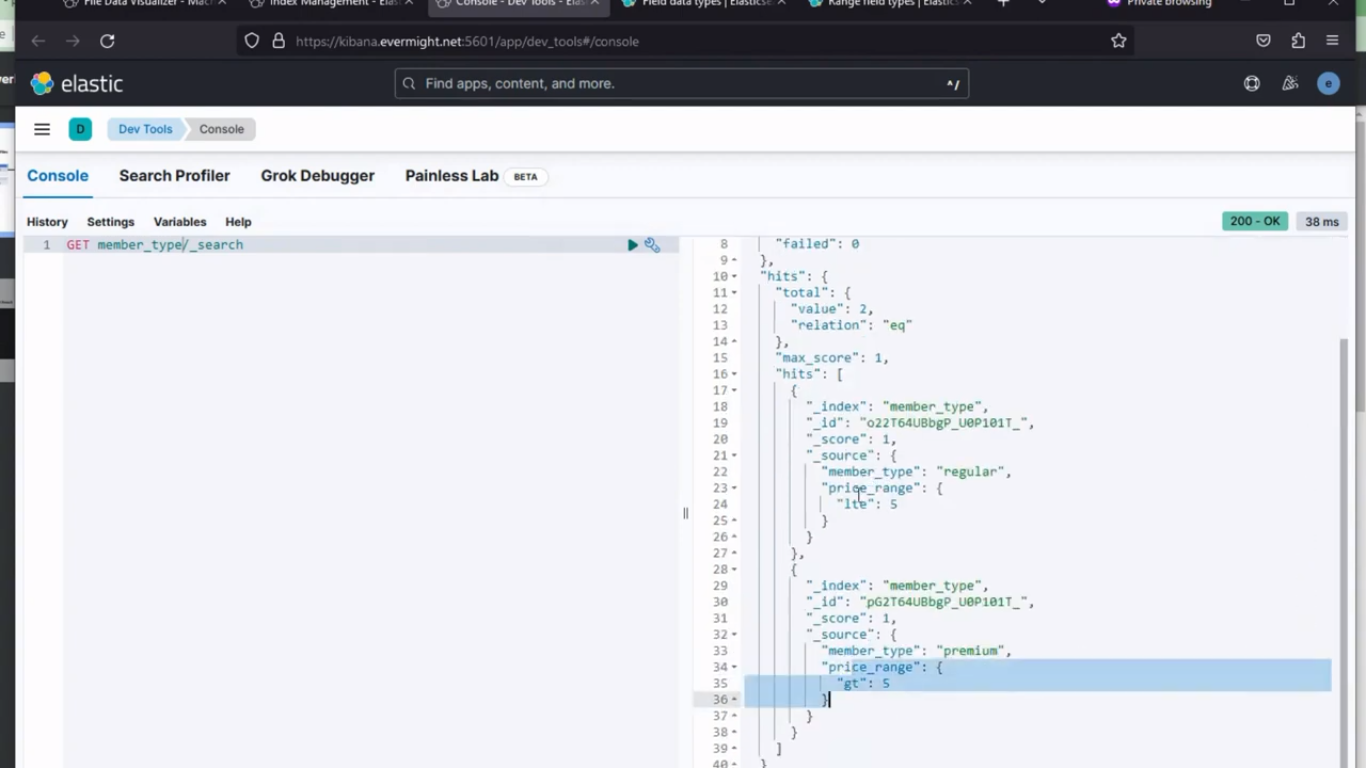 Quereyed data
Set up policies [14:50]
Set Up user Policy [15:00]
In Kibana, go to Dev Tools > Console. Paste the below command in the console, and run the Policy command:
PUT /_enrich/policy/user_policy
{
  "match": {
    "indices": "user",
    "match_field": "email",
    "enrich_fields": ["first_name", "last_name", "city", "zip", "state"]
  }
}
Use the below command to create an enrich index for the policy.
PUT /_enrich/policy/user_policy/_execute
After running, It should produce a similar result to the image below;
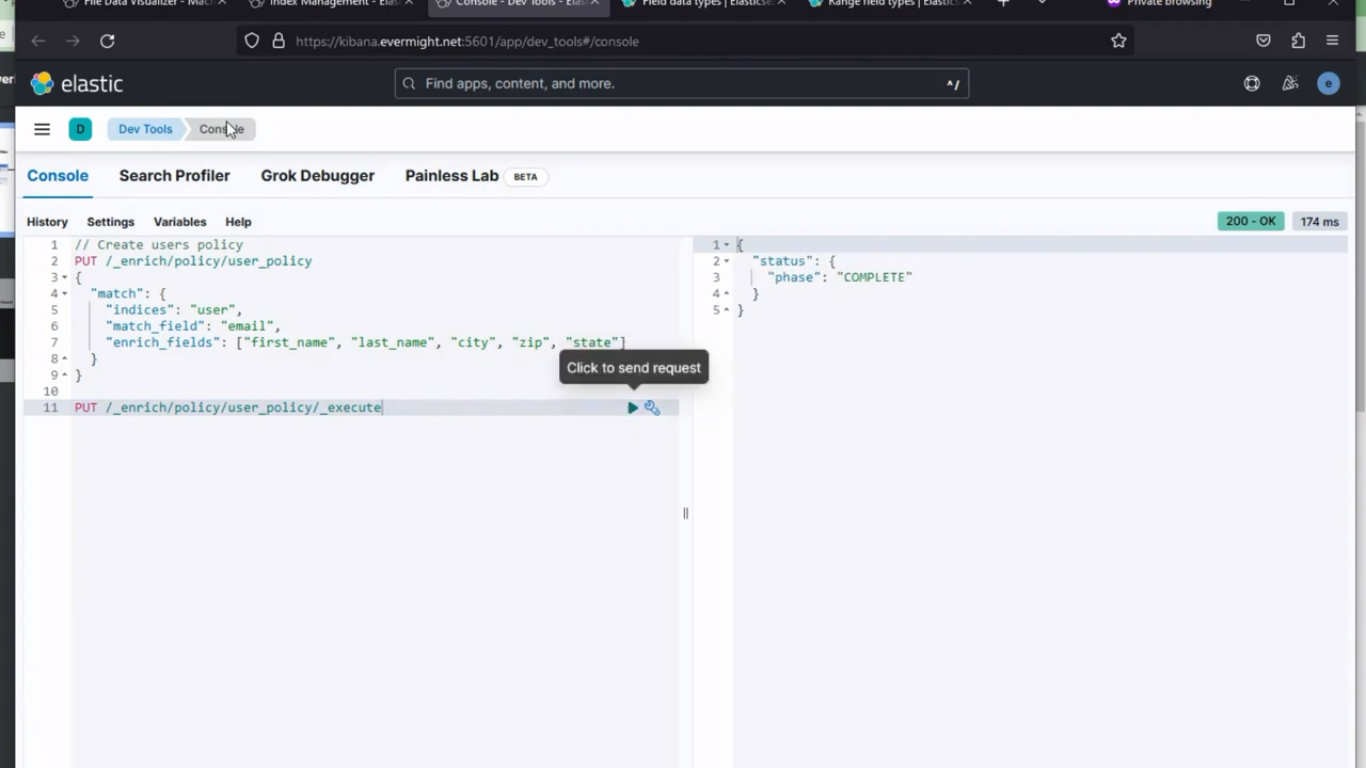 Console result for user policy enrich
To confirm the index was enriched successfully, go to Stack Management > Index Management, toggle the include hidden indices button On, then reload indices. And you should see a similar result to the image below:
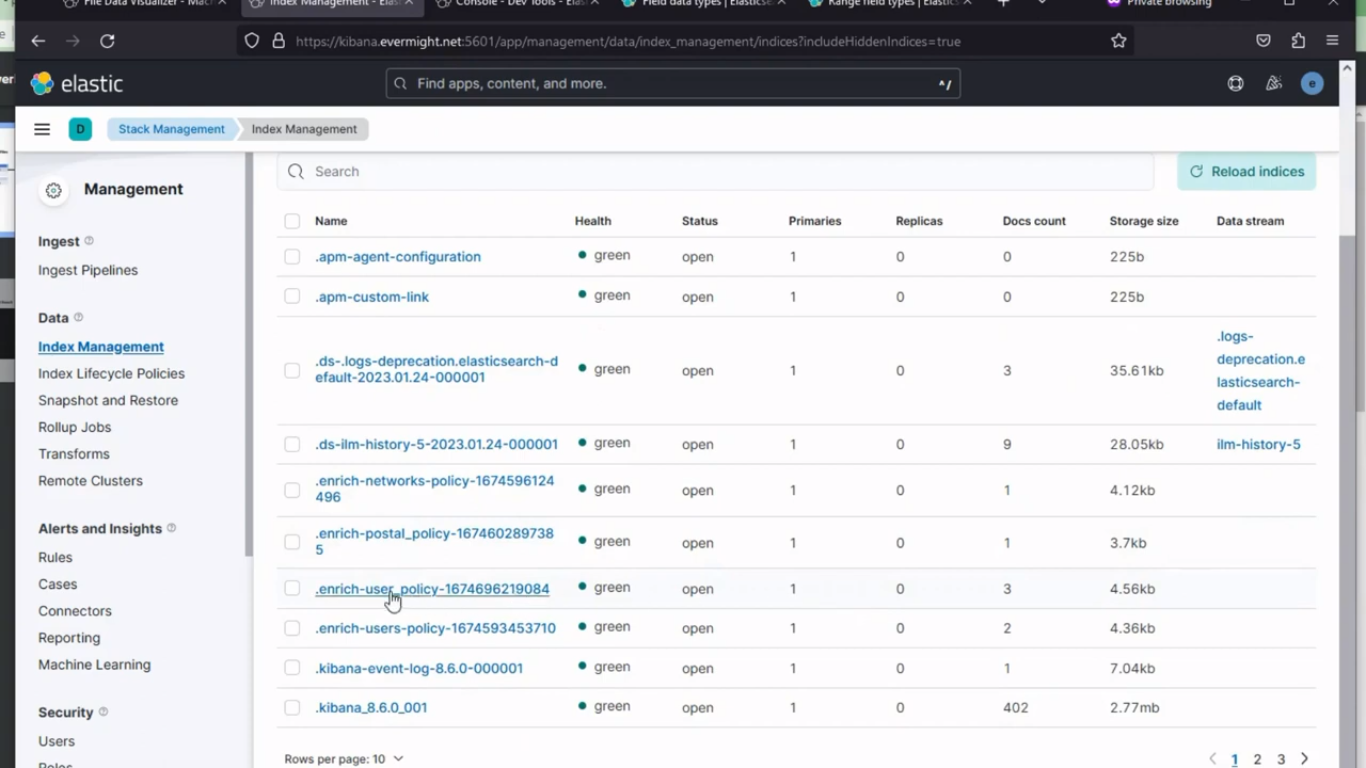 Index for user enriched succesfully
Set Up location policy [16:16]
In Kibana, go to Dev Tools > Console. Paste the below command in the console, and run the Policy command:
PUT /_enrich/policy/location_policy
{
"match": {
  "indices": "location",
  "match_field": "location_id",
  "enrich_fields": ["point"]
}
}
Use the below command to create an enrich index for the policy.
PUT /_enrich/policy/location_policy/_execute
After running, It should produce a similar result to the image below;
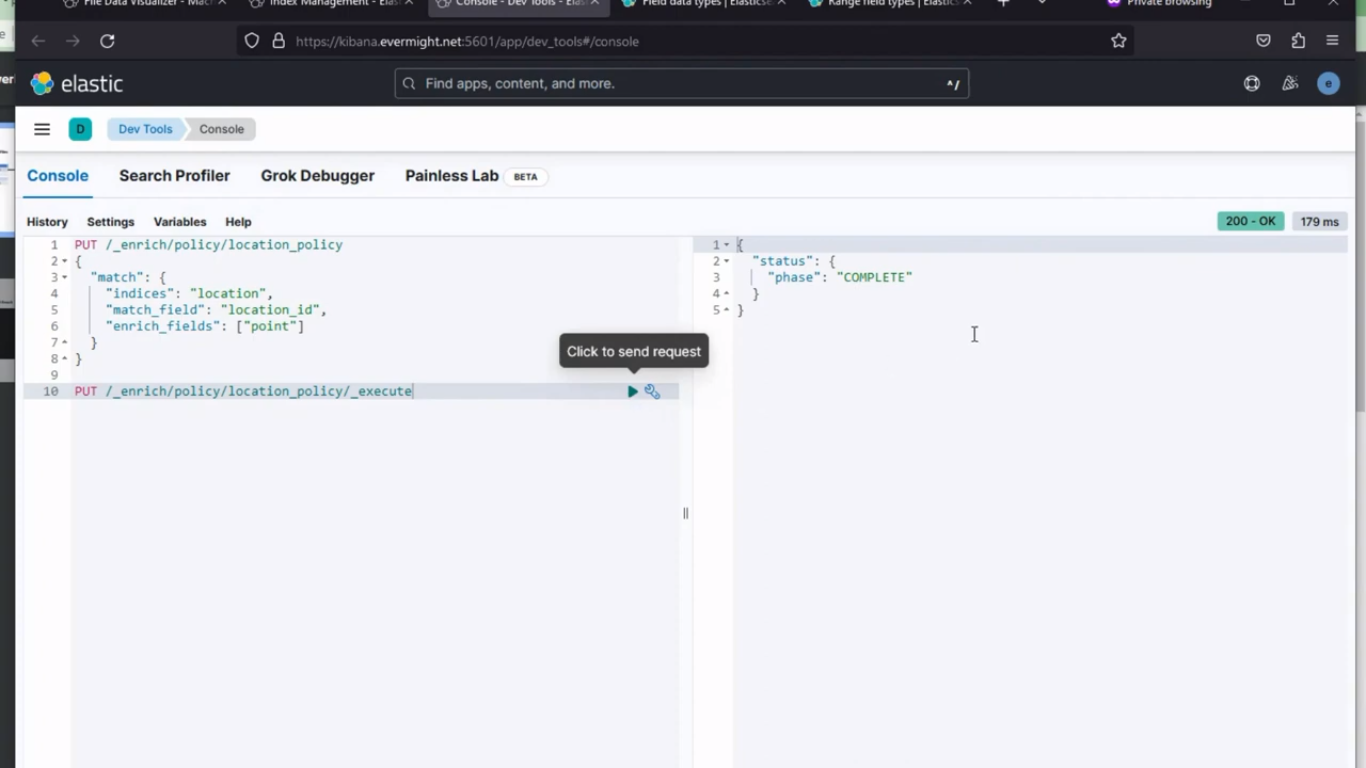 Console result for location policy enrich
To confirm the index was enriched successfully, go to Stack Management > Index Management, toggle the include hidden indices button On, then reload indices. And you should see a similar result to the image below:
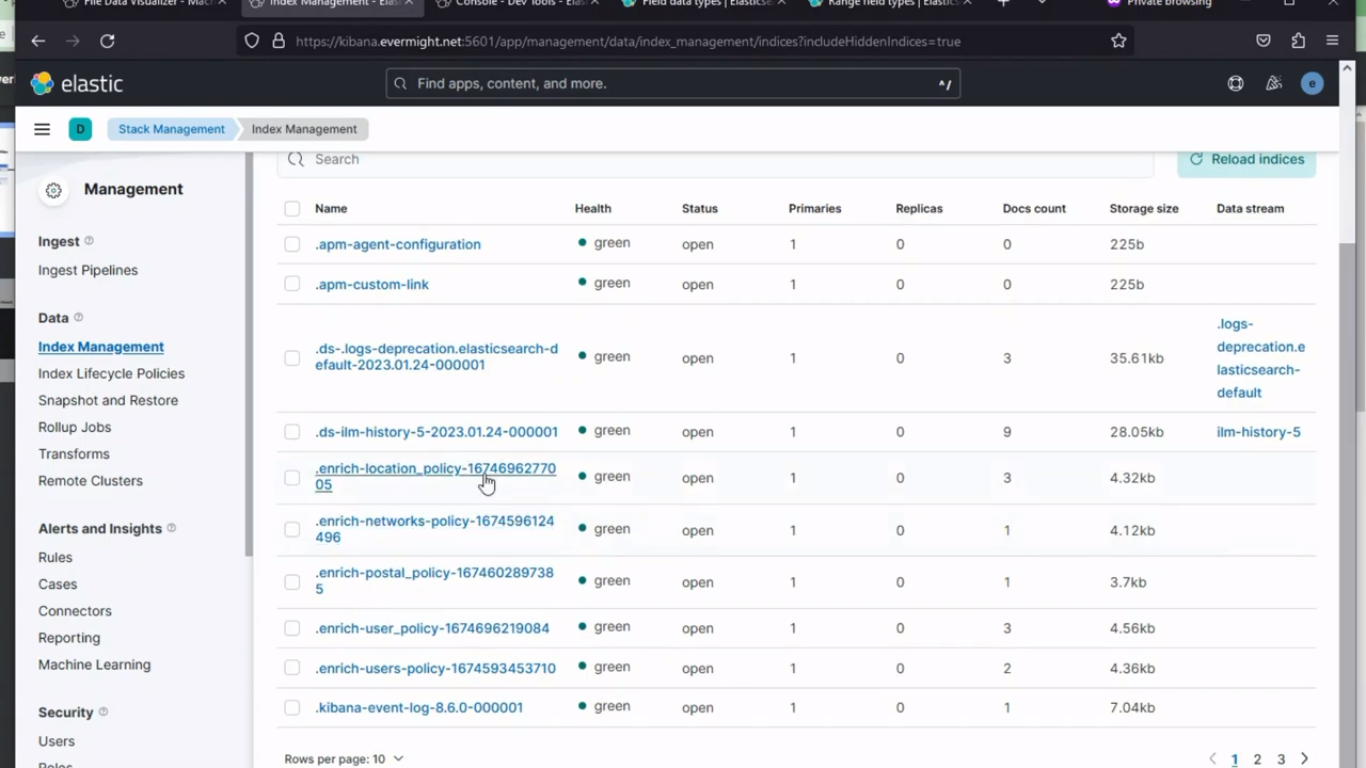 Index for location enriched succesfully
Set Up member_type policy [17:05]
In Kibana, go to Dev Tools > Console. Paste the below command in the console, and run the Policy command:
PUT /_enrich/policy/member_type_policy
{
"range": {
  "indices": "member_type",
  "match_field": "price_range",
  "enrich_fields": ["member_type"]
}
}
Use the below command to create an enrich index for the policy.
PUT /_enrich/policy/member_type_policy/_execute
After running, It should produce a similar result to the image below;
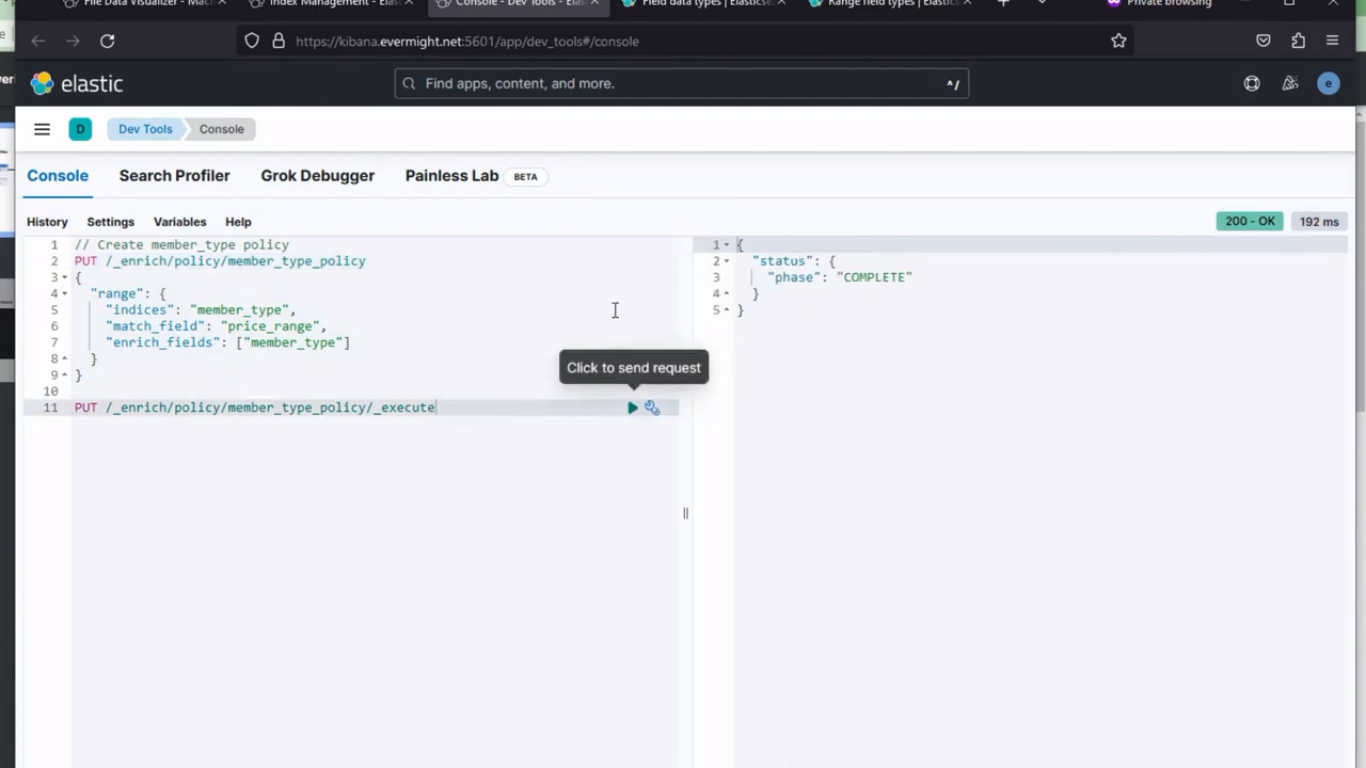 Console result for member type policy enrich
To confirm the index was enriched successfully, go to Stack Management > Index Management, toggle the include hidden indices button On, then reload indices. And you should see a similar result to the image below:
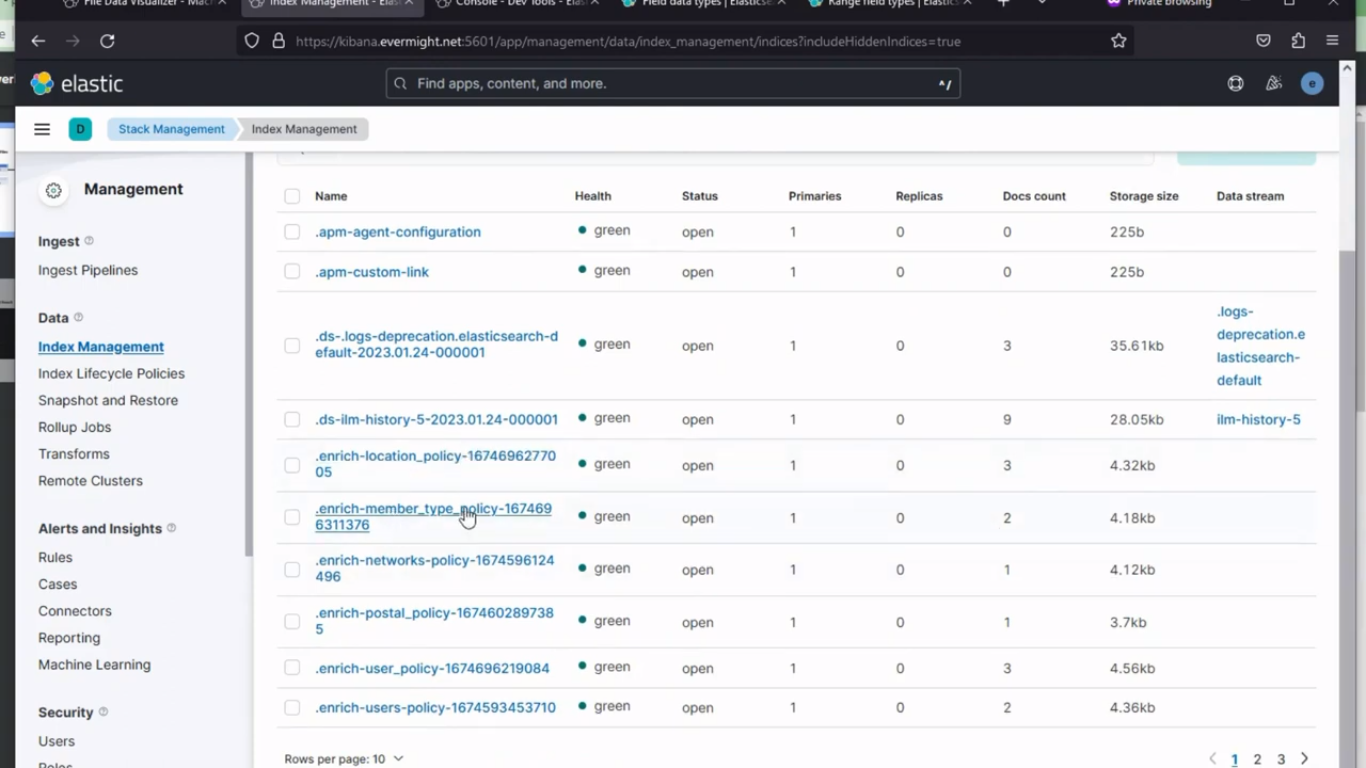 Index for member type enriched succesfully
Ingest signup.csv (multiple source indices) [17:45]
In Kibana, go to Machine Learning > Data Visualizer. And then upload the signup.csv file data. Give it an index name of signup.
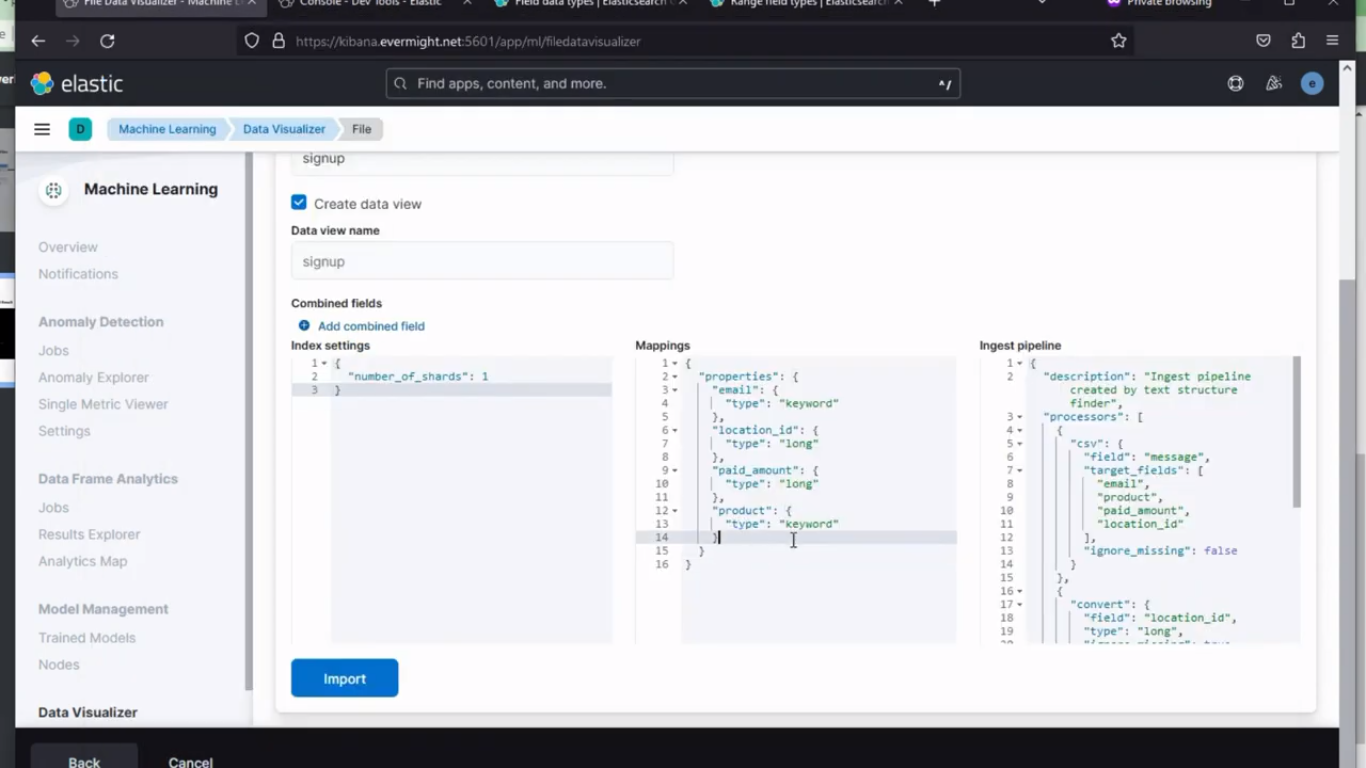 Mappings And Pipeline Change: Before
Add the following into mapping section:
"geo": {
  "properties": {
    "point": {
      "type": "geo_point"
    }
  }
}
and also add the following into the pipeline section
{
  "enrich" : {
    "description": "Add 'user' data based on 'email'",
    "policy_name": "user_policy",
    "field" : "email",
    "target_field": "user",
    "max_matches": "1"
  }
},
{
  "enrich" : {
    "description": "Add 'member_type' data based on 'paid_amount'",
    "policy_name": "member_type_policy",
    "field" : "paid_amount",
    "target_field": "member_type",
    "max_matches": "1"
  }
},
{
  "enrich" : {
    "description": "Add 'geo' data based on 'location_id'",
    "policy_name": "location_policy",
    "field" : "location_id",
    "target_field": "geo",
    "max_matches": "1"
  }
},
as shown in the image below:
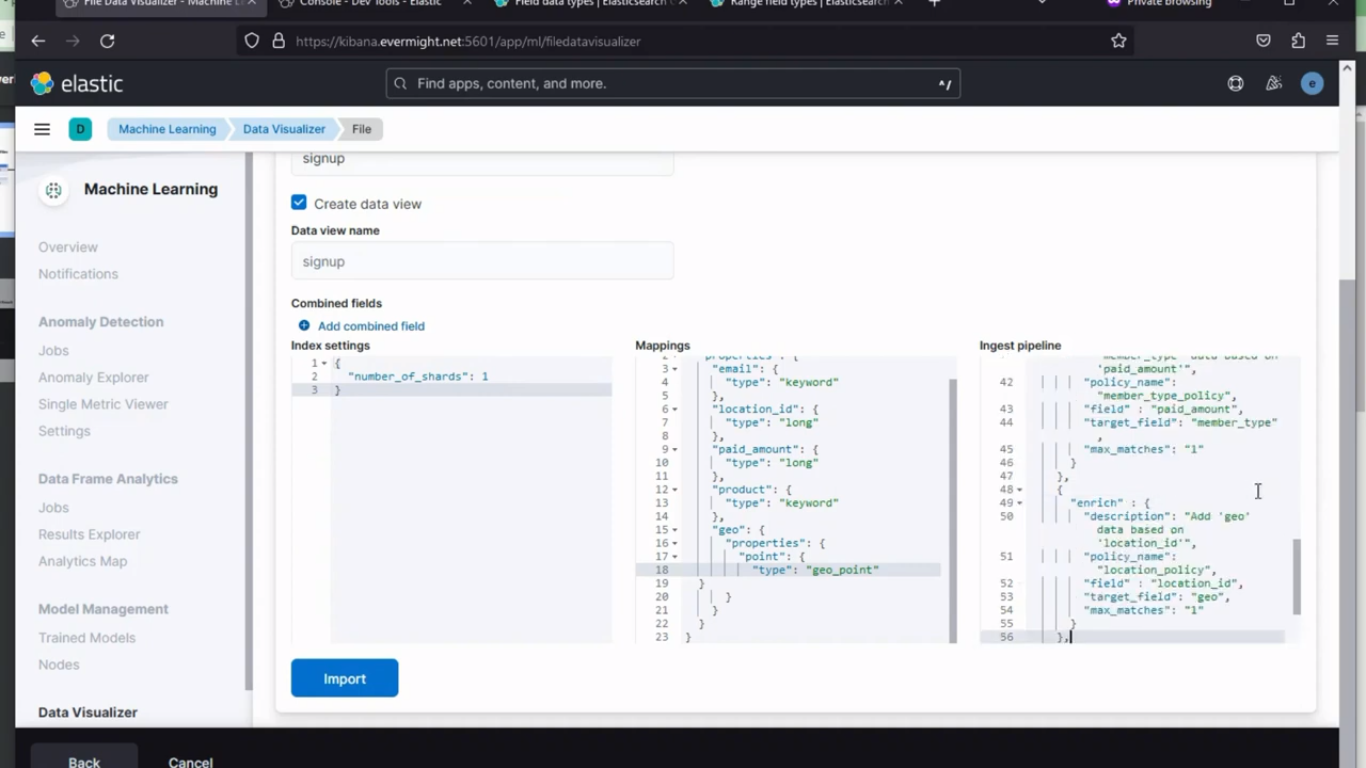 Mappings Change: After
and then click on import.
To confirm the index was created, go to Stack Management > Index Management. And you should see a similar result to the image below:
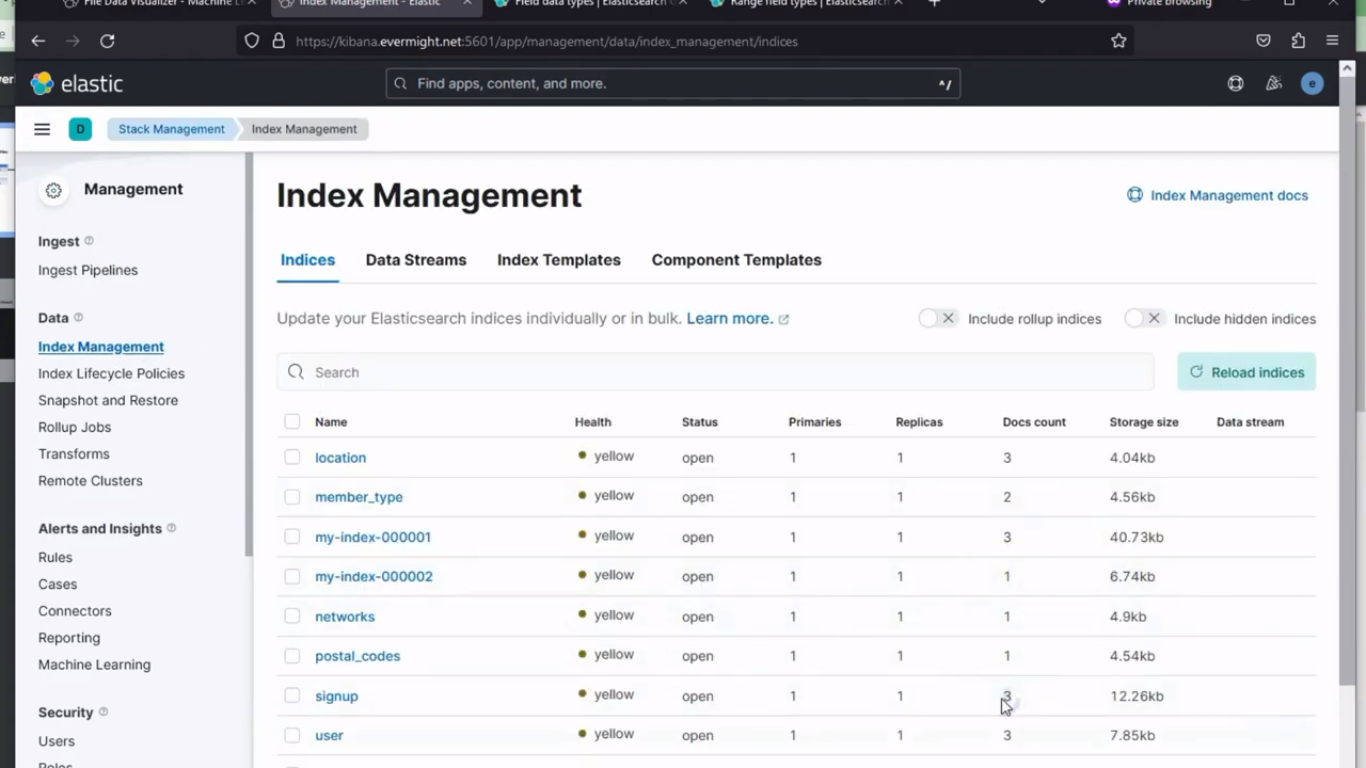 Index created succesfully
To view the data, go to Dev Tools > Console in Kibana. and do a search with the below command:
GET signup/_search
and you should see a result similar to this:
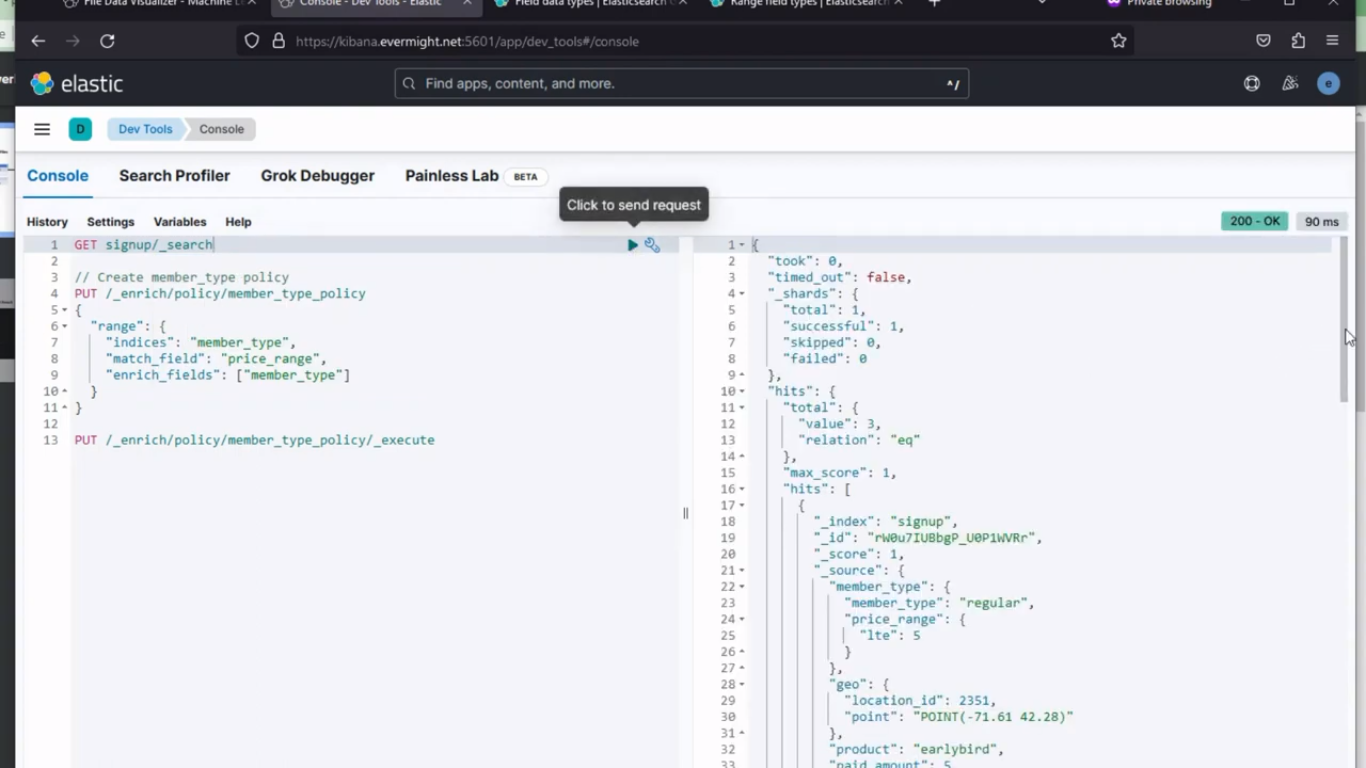 Quereyed data
Test data with visualization [23:40]
In Kibana, go to Visualize Library and click on Create new visualization, and then choose Maps from the options, and then click on Add Layer, and pick a Heat map, click on data view and choose signup.
you should see a result similar to this:
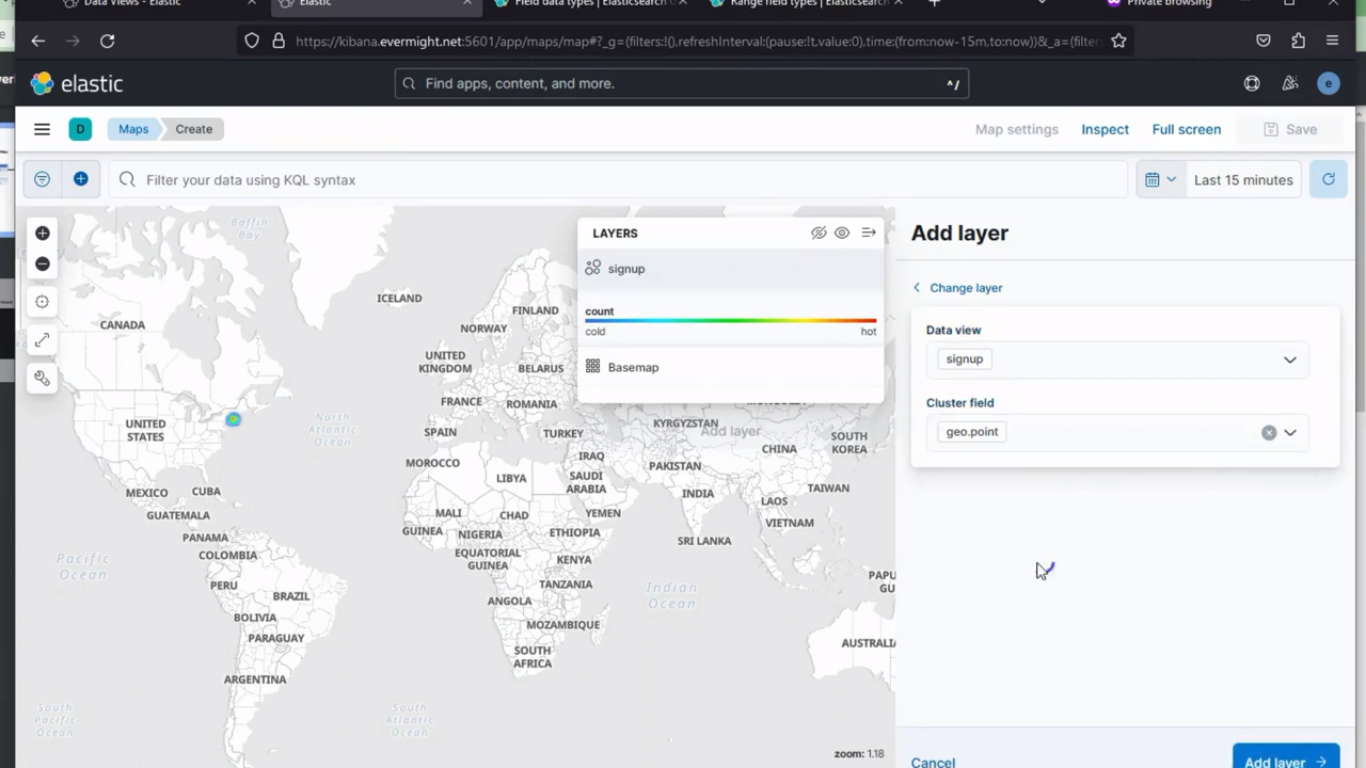 Heat Map selection
and then click on Add layer.
Now inn the metrics field, select the following:
Aggregation: Sum
Field: paid_amount
Now save the Map, by clicking on Save and go to Dashboard
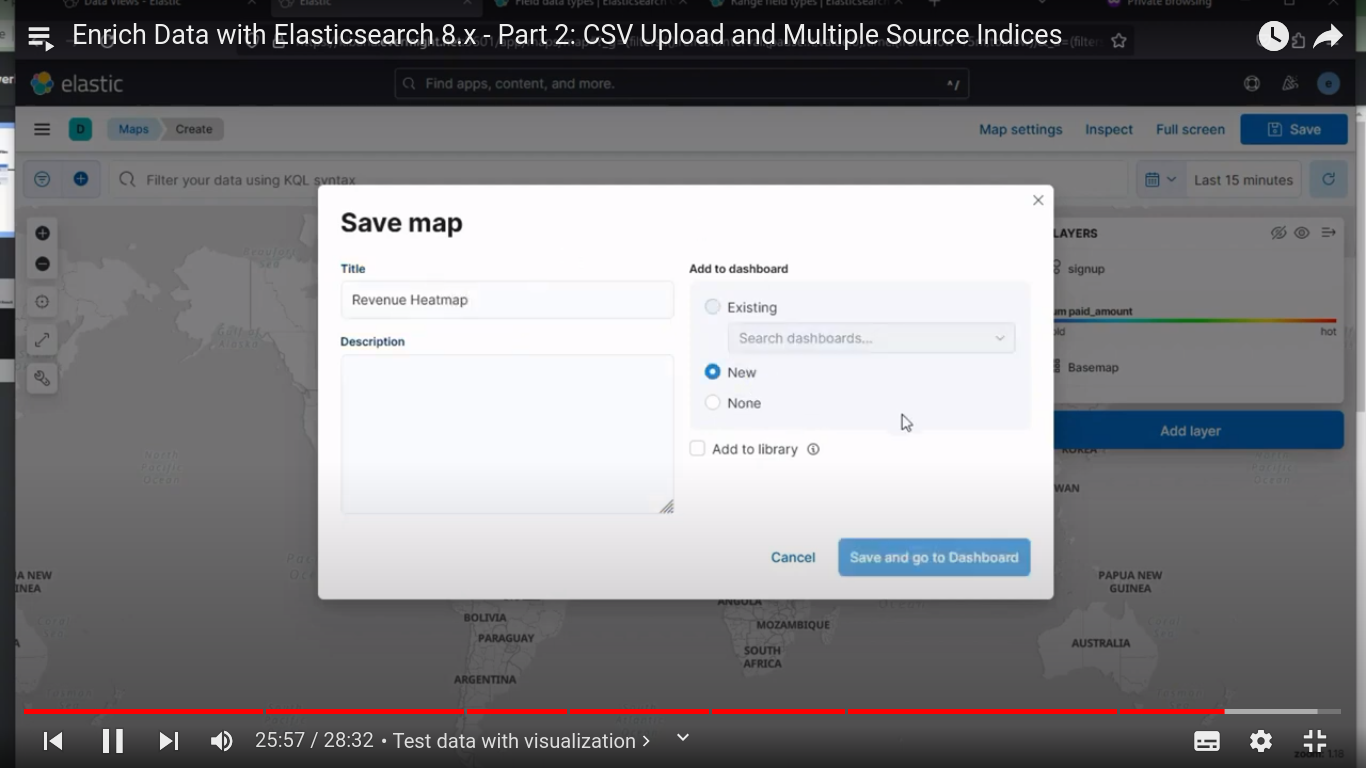 Save the heat map
Save the Dashboard as Demo Dashboard.
Create a second Visualization while dragging and dropping the required metrics from the left to the right horizontal axiz, and choose sum on the vertical axis as shown in the image below:
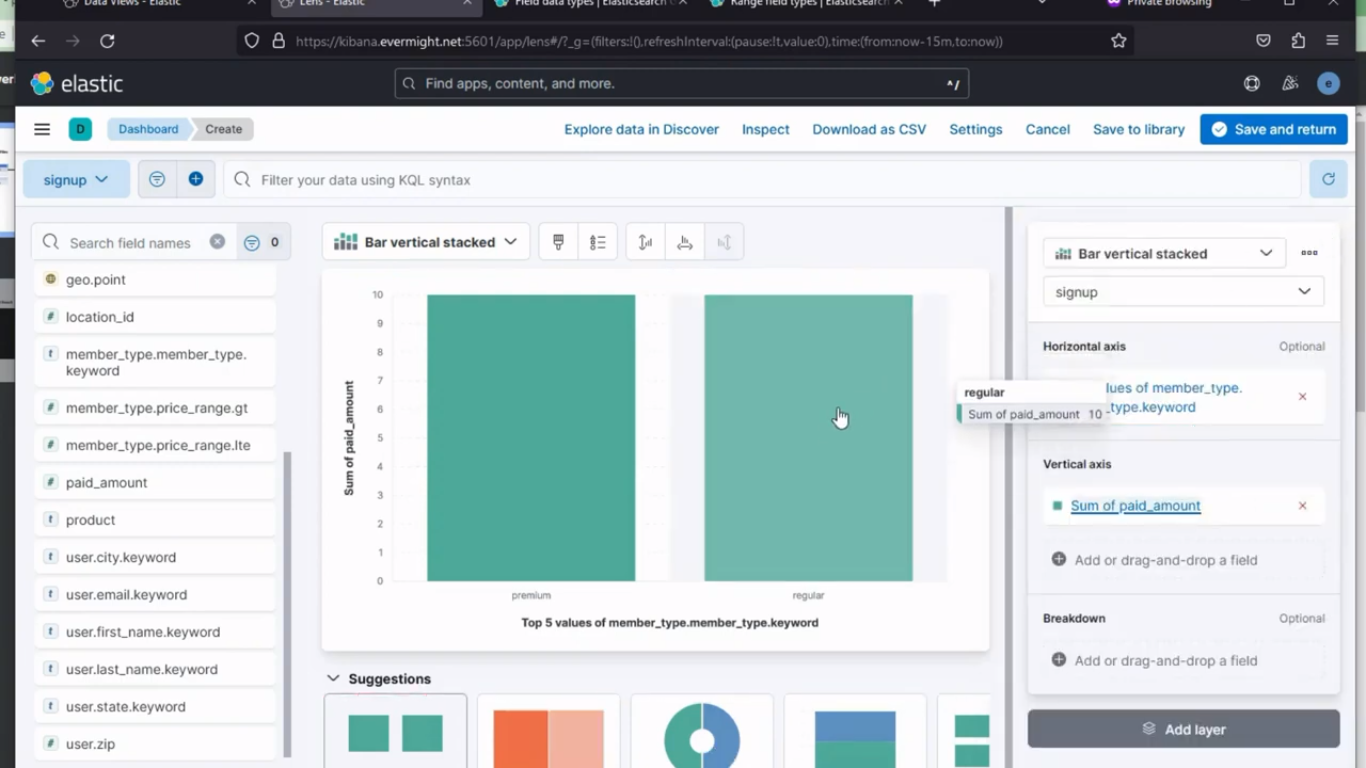 2nd visualization
Then click on Save and return.
Create a third Visualization while dragging and dropping the required metrics from the left to the right horizontal axiz, and choose sum on the vertical axis as shown in the image below:
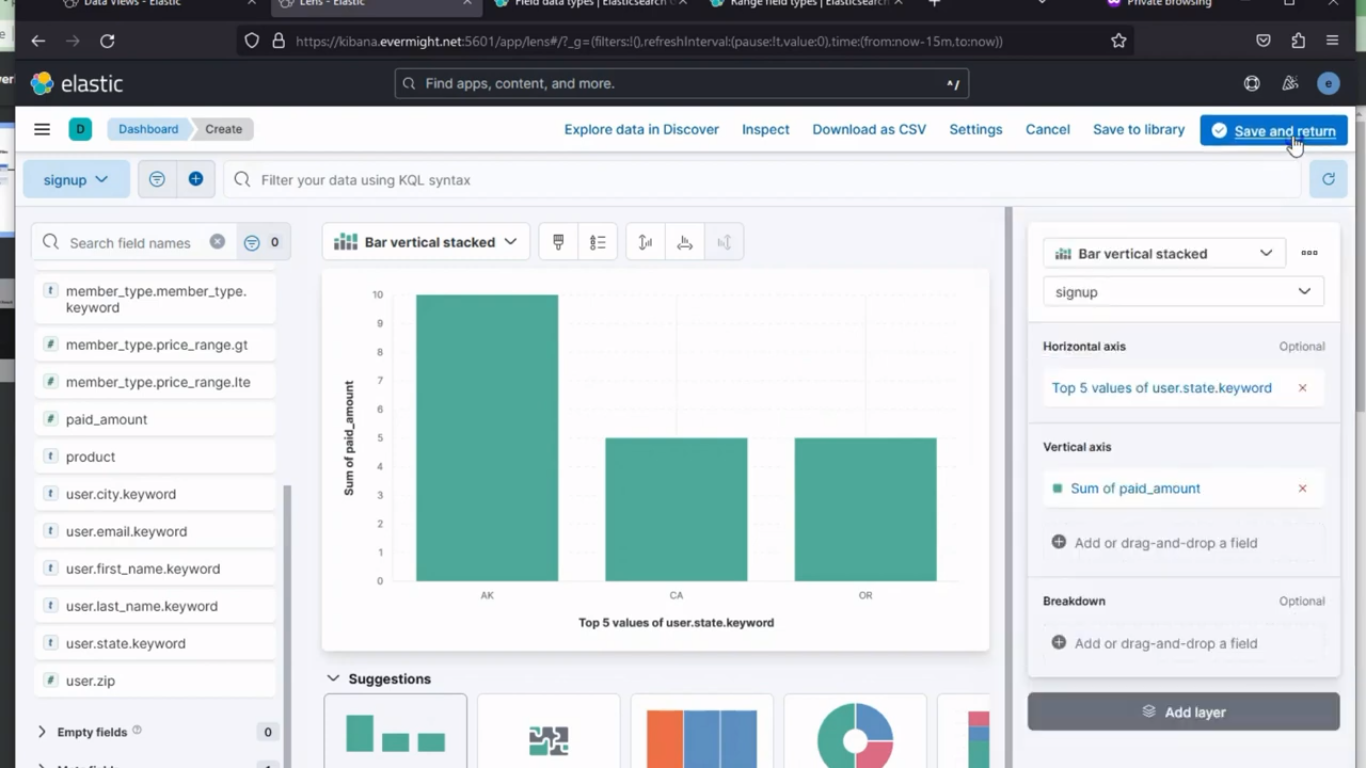 3rd visualization
Then click on Save and return.
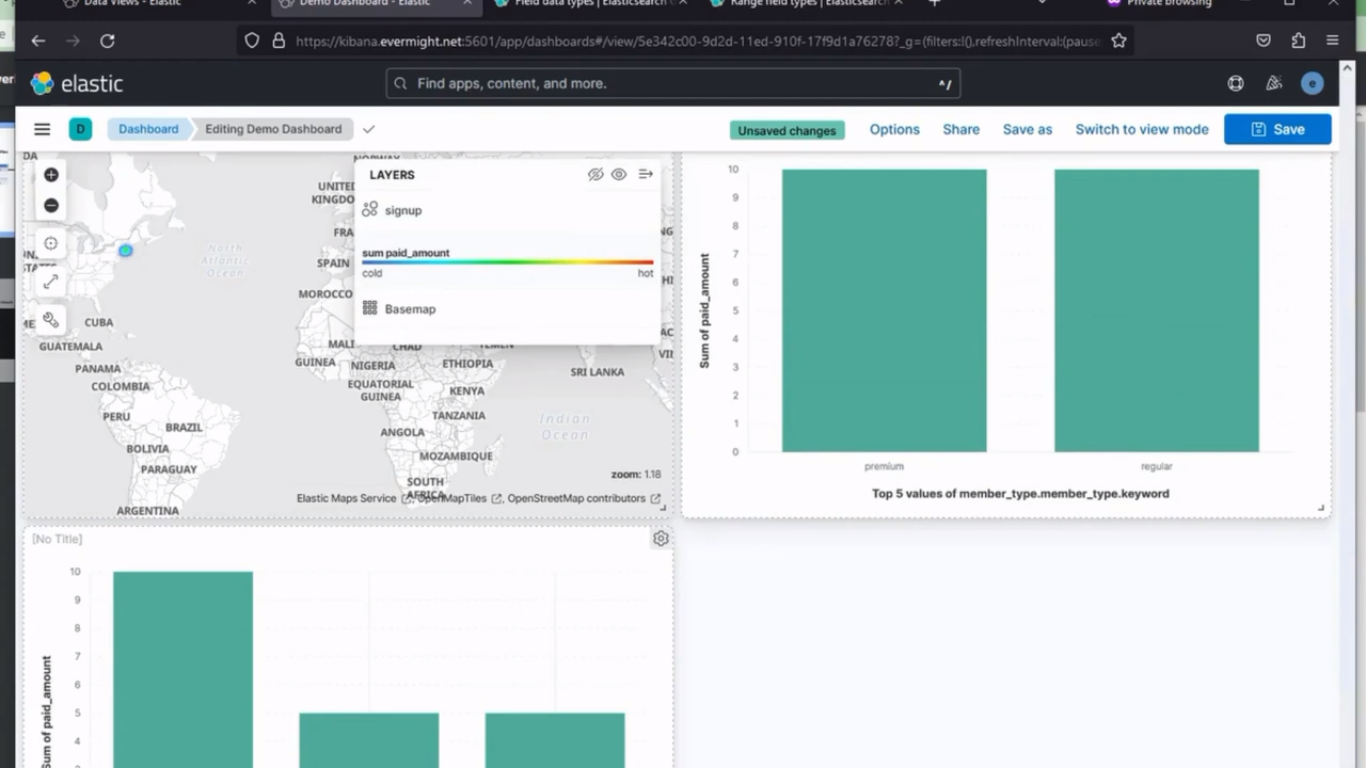 All three visualization
