Introduction
Code on Github: Elasticsearch + Docker Part 2
We will setup Elasticsearch, Kibana, Elastic Agent, Fleet Server, and APM with Docker Compose.
This video assumes you already know how to a setup Elaticesearch, Kibana, Beats, and Logstash without using a Container. If not then you can go here setup. And you should understand Elastic Agent, Fleet Server and APM TBD.
Requirements
- A new instance of Linux machine like Ubuntu 20.04 to act as the Server
- Docker and Docker-Compose Installed
- Docker containers from previous Docker + ELK video
Step 1 - Checkout the code [02:30]
Shut down previous Running Docker containers with the below command;
docker-compose down --remove-orphans --volumes
Make a new directory for this part 2
mkdir ../es2
cd ../es2
Initialize a new git repository.
git init;
git remote add origin https://github.com/evermight/elastic-stack-docker-part-two.git;
git fetch -a;
git checkout main
List out all files in the directory.
ls -alh
Build with the below docker compose command.
docker-compose up --build -d
Run the below command to get the details of all containers:
docker ps -a
Get the IP address of your server for it will be used as the url to the docker containers.
hostname -i
Visit Kibana page with http://<YOUR IP ADDRESS>:5601.
Then login with the elastic username and password present at the .env file
username: elastic
password: changeme
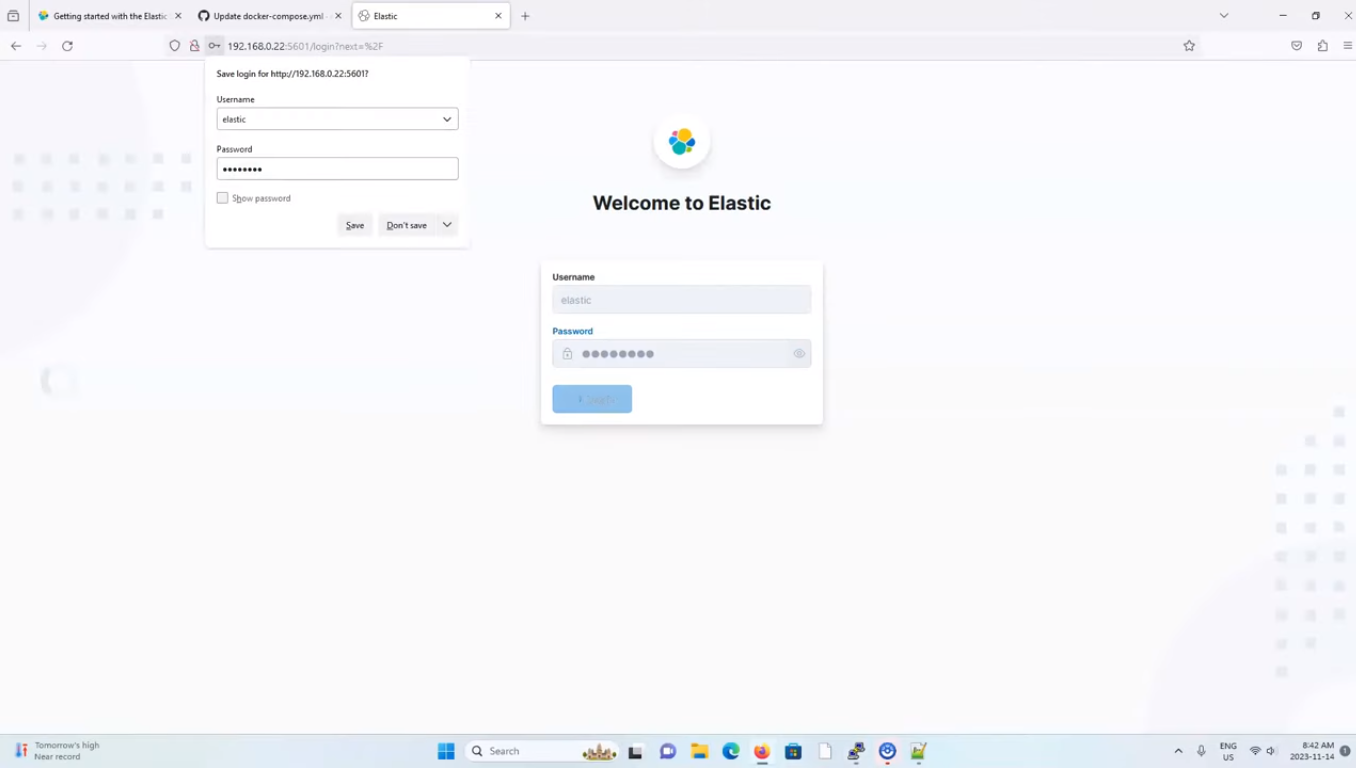 Kibana Login page
Step 2 - Confirm services are operational [06:45]
Go to Fleet > settings, and click on the edi pen icon. Reference the below image;
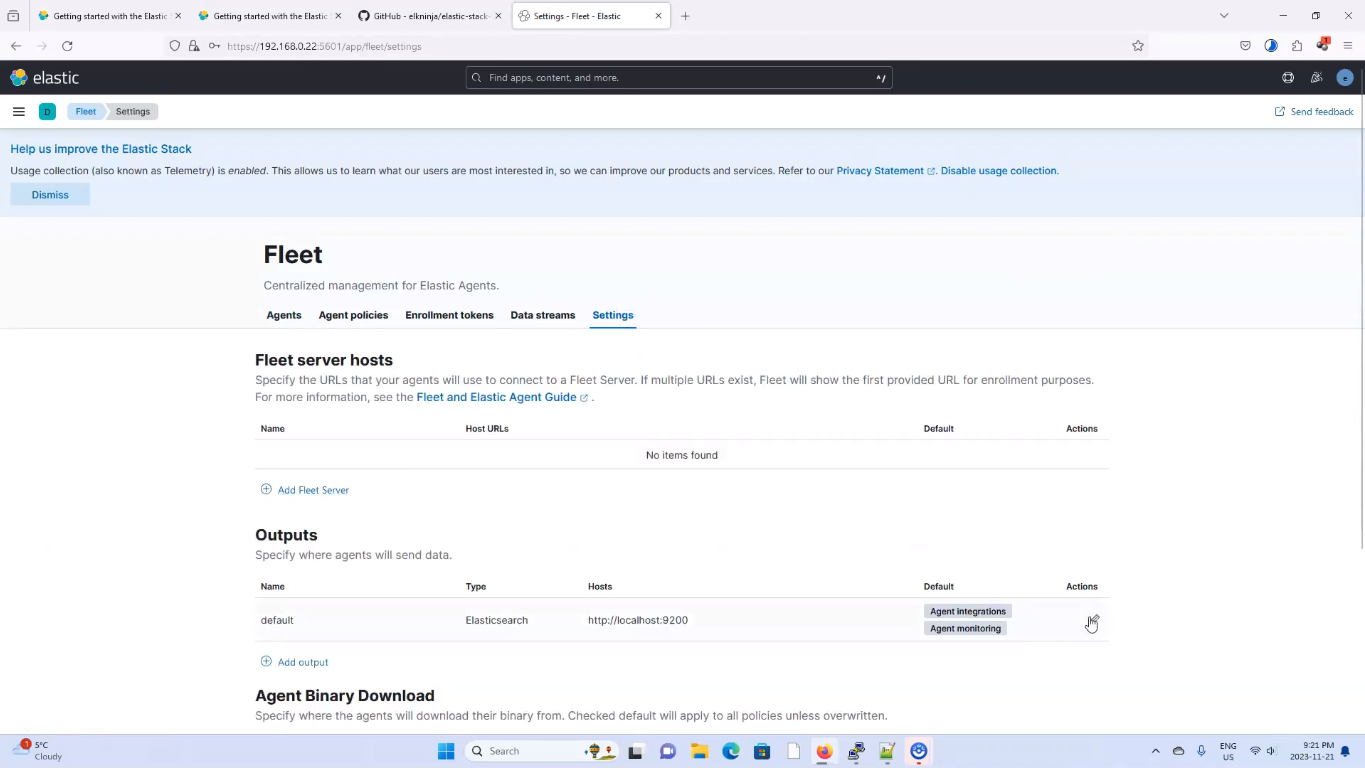 Edit Fleet Server Output
To get the certificate fingerprint, run the following commands:
docker cp es-cluster-es01-1:/usr/share/elasticsearch/config/certs/ca/ca.crt /tmp/.
and Run the below to get the certificate fingerprint.
openssl x509 -fingerprint -sha256 -noout -in /tmp/ca.crt | awk -F"=" {' print $2 '} | sed s/://g
Use the below command to output the certificate;
cat /tmp/ca.crt
Once you have the certificate text, we will add it to a yml format and input all this information into the Fleet Settings screen from earlier.
ssl:
certificate_authorities:
- |
and add the contents and space accordingly as shown in the image below.
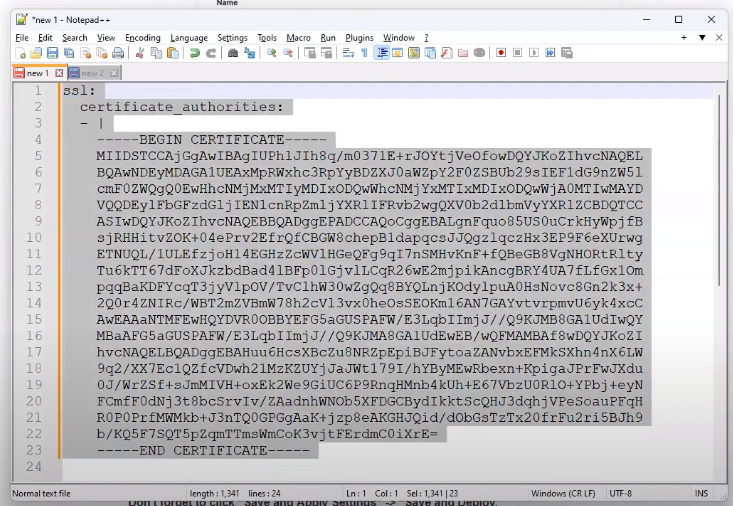 Certificate in Yml style
Update the fields in your Kibana as shown in the image below;
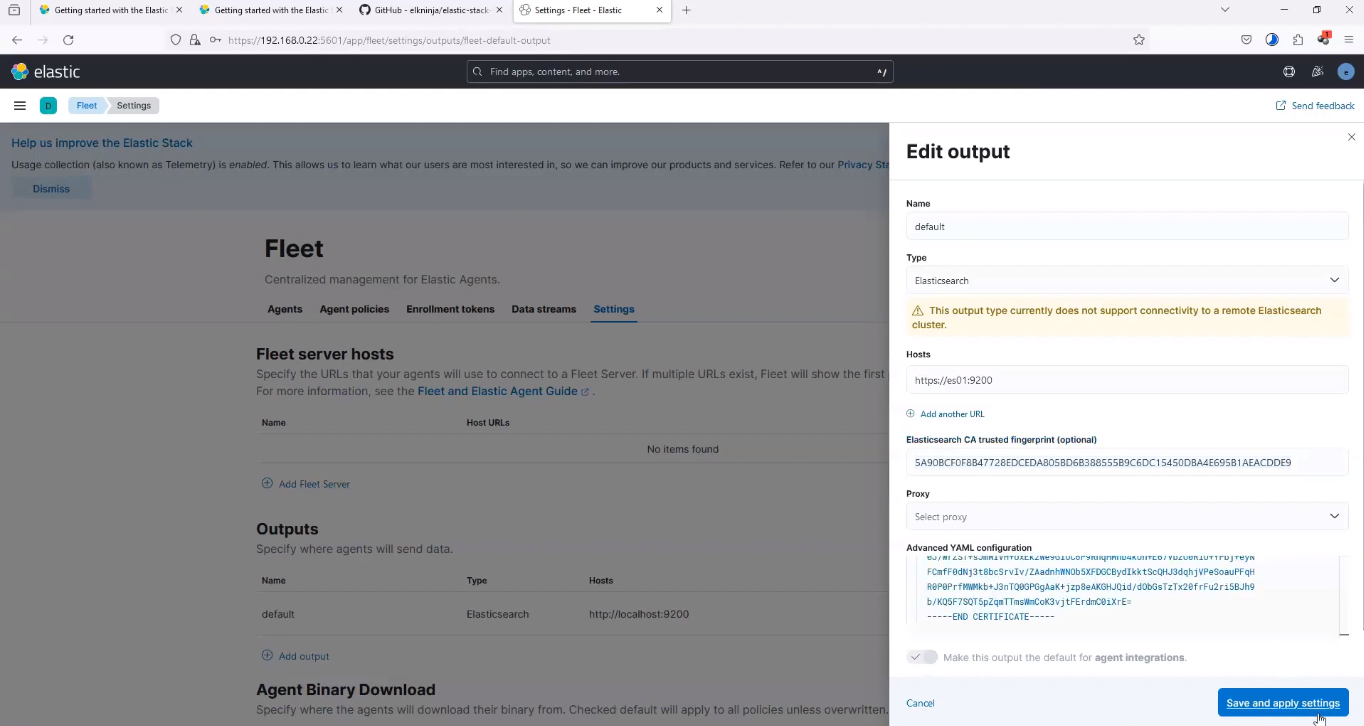 Fleet Server changes
then click on Save and apply settings, and then proceed to click on Save and deploy. Now go back to the Fleet > Agent and refresh the tab. You should see something similar to the image below, which indicates that Elastic Agent, AM and Fleet Server are up abd running.
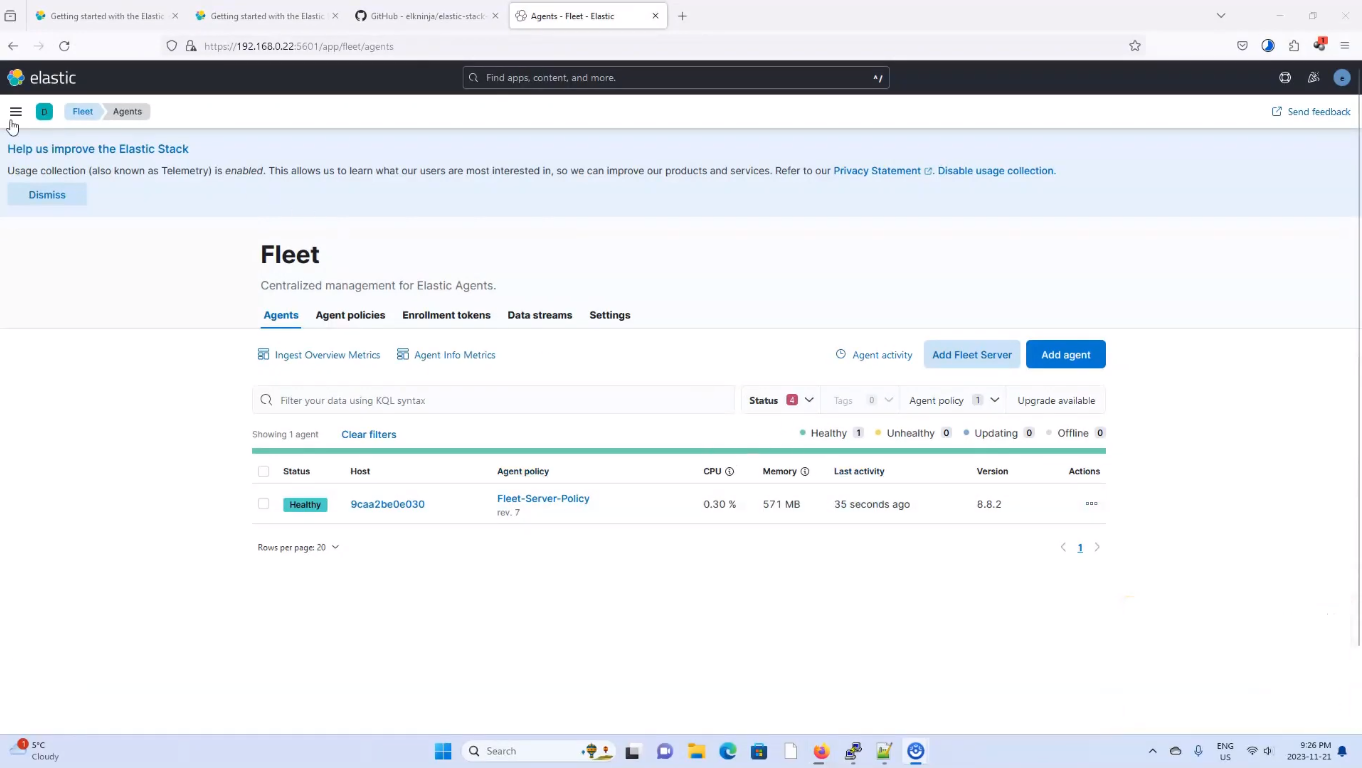 Elastic Agent, APM, and Fleet Server Running Success
To view the APM services go to Observability > APM > Services, and you should see something similar to the image below
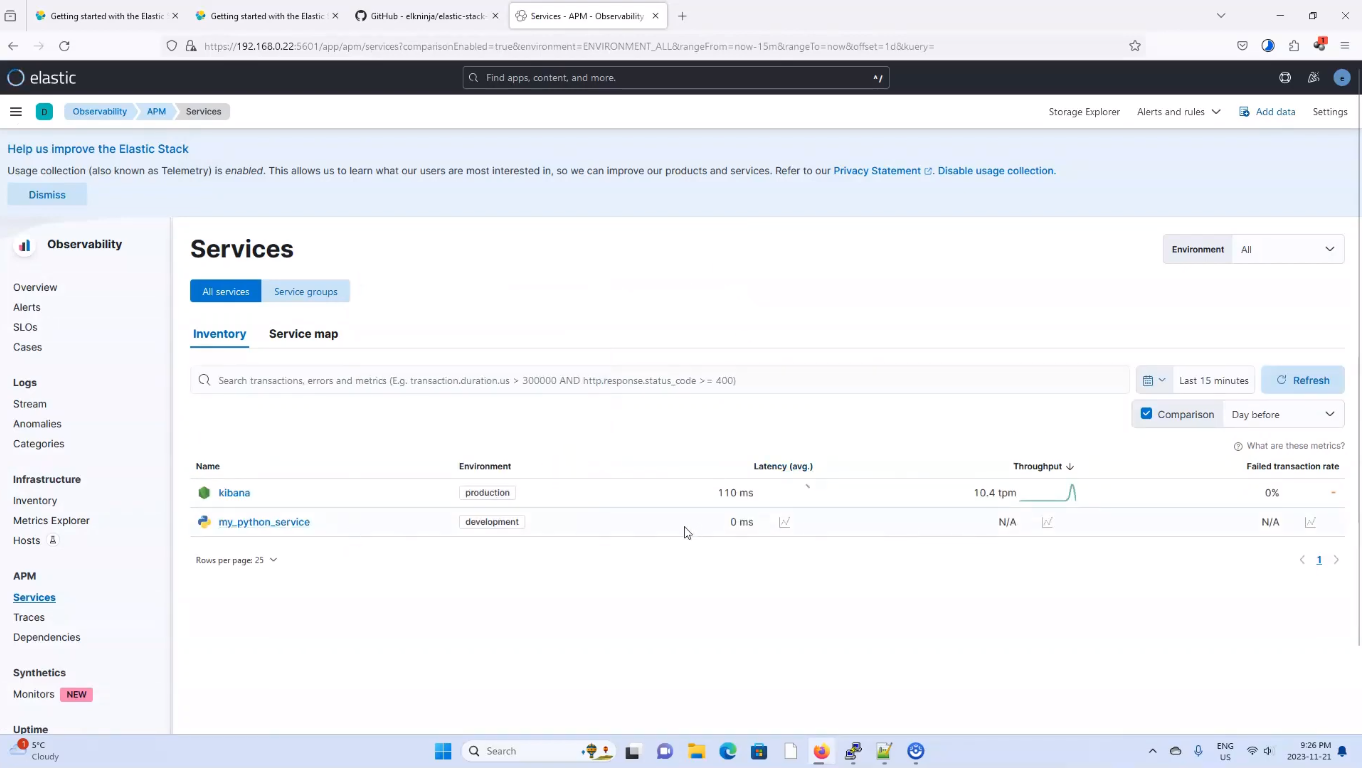 APM Success
To view the logs for the python web app, use the below command;
docker logs es-cluster-webapp-1
You should get a similar result to the image below;
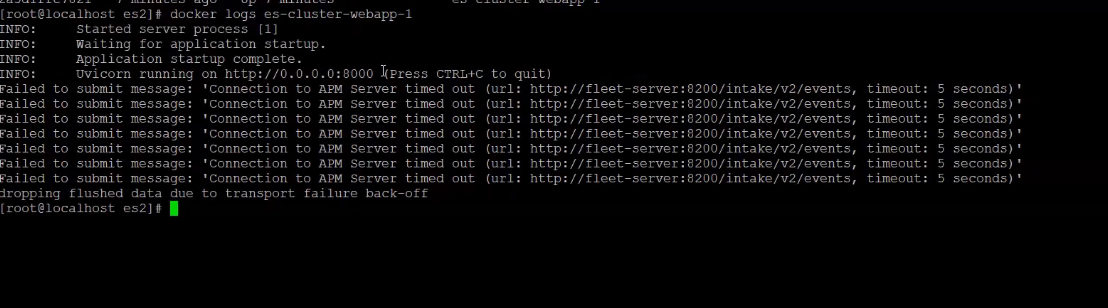 WebApp Logs
Go to your browser and run the url http://0.0.0.0:8000
And the WebApp should look similar to the image below;
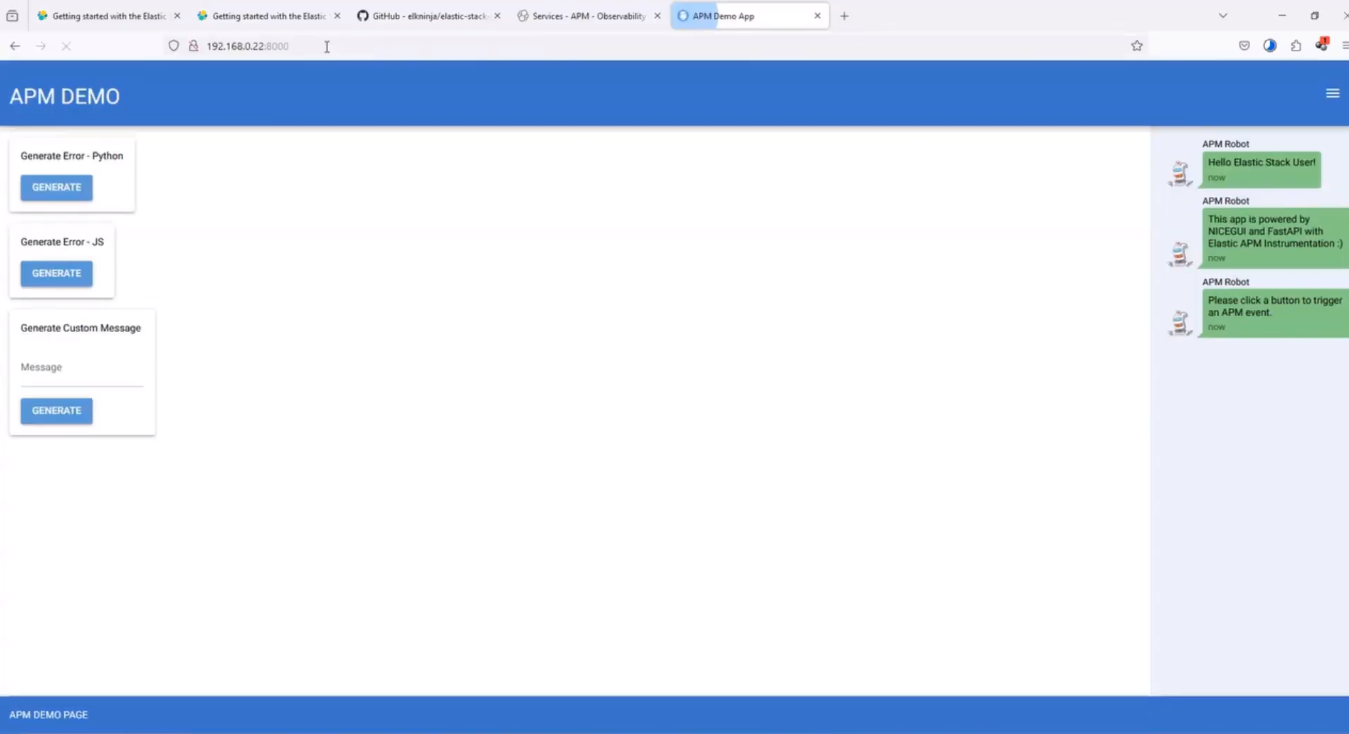 WebApp Website
Click on the generate buttons present right there, so the webapp it will send some message to Elastic. Go to Observability > APM > Services > my python service > overview and hit refresh to view the requests made. Below is a screenshot of how it looks like;
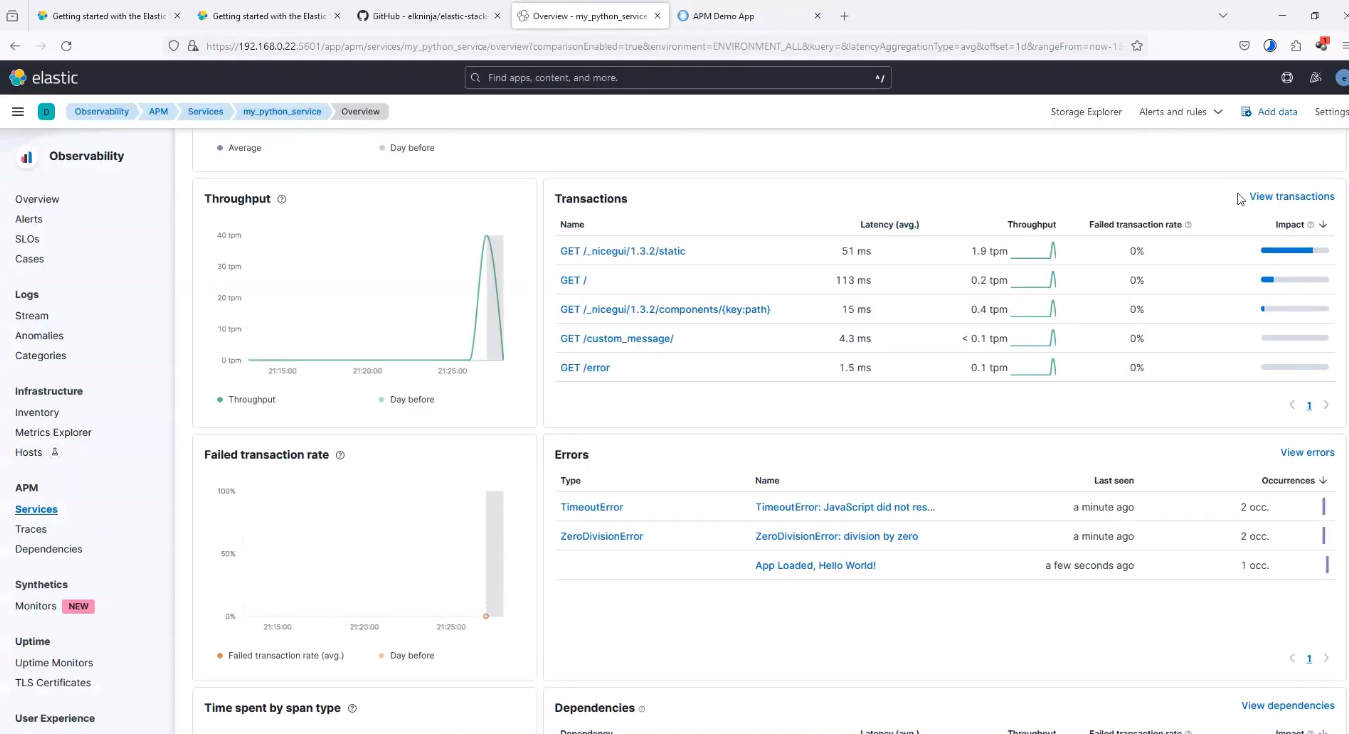 my_python_service Requests