
Introduction
Code on Github: Elasticsearch and Application Performance Monitoring
We will setup Application Performance Monitoring with Elasticsearch and Kibana. If you do not have Elasticsearch and Kibana set up yet, then follow these instructions.
This video assumes you are using Publicly Signed Certificates. If you are using Self Signed Certificates, go here TBD.
Requirements
A running instance of Elasticsearch and Kibana.
A new instance of Ubuntu 20.04 to act as the Fleet Server
Steps
Step 1 - Update Ubuntu [06:45]
On the Ubuntu machine that will be used as a fleet server, run this command to update the operating system and download useful tools:
apt-get update && apt dist-upgrade -y && apt-get install -y vim curl gnupg gpg
Step 2 - Setup Fleet Server Hosts [08:00]
Login to Kibana and go to the Menu, Fleet > Settings > Edit Hosts and enter https://<fleet-server-url>:8220 as shown in this screenshot:
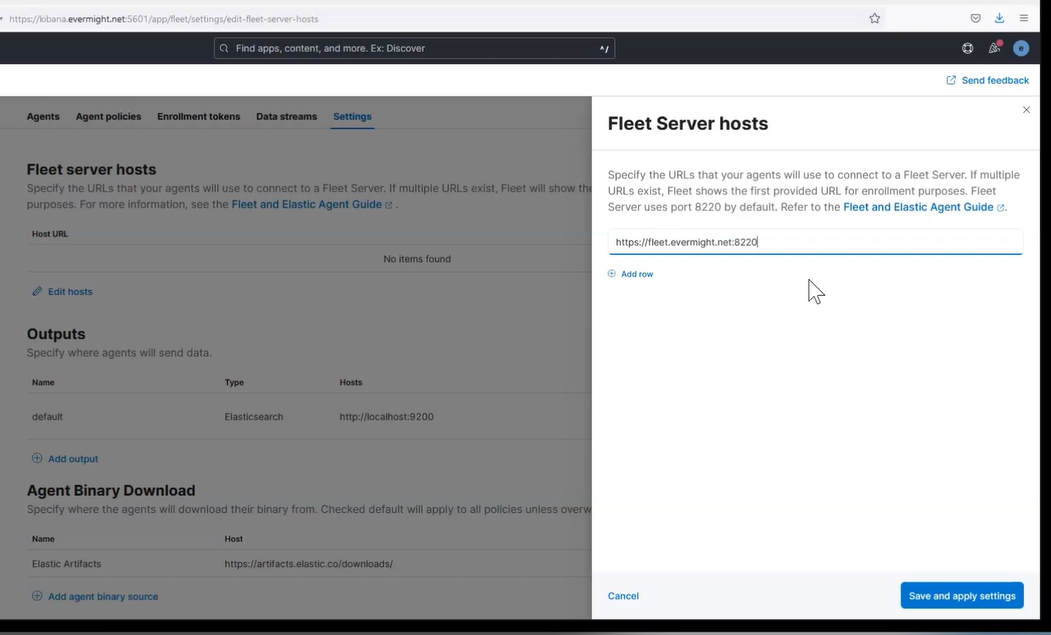
Then press save.
Step 3 - Setup Fleet Server Outputs [09:30]
Go to the Outputs section and click on Add output.
Fill out these fields as shown in this image:
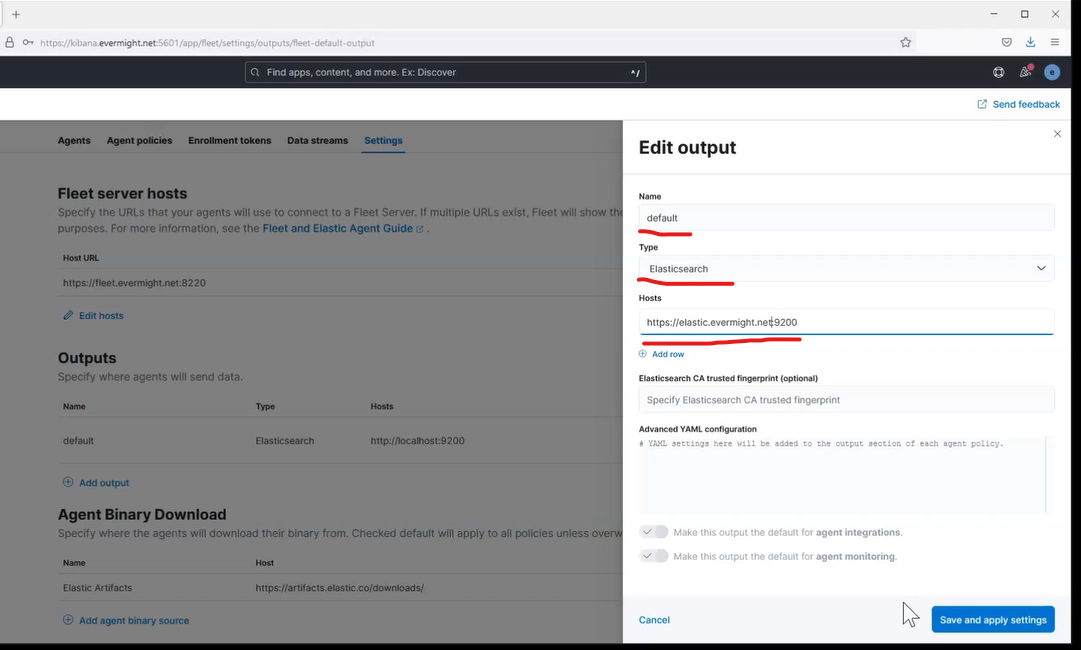
In short:
Name: default
Type: elasticsearch
Hosts: https://<elasticsearch url>
Step 4 - Upload SSL Certificates for Fleet Server [15:44]
mkdir /etc/certs/<fleet-server-domain>/
Upload the SSL certificates for your fleet server to this directory
Step 5 - Install Fleet Server with Elastic Agent [11:30]
Go to the Agents tab.
Click Advanced.
Click Create Policy.
For Choose a deployment mode for security and choose Production.
For Add your Fleet Server host, click Add host for the url created in Step 2.
Click Generate Service Token.
Copy the installation commands:
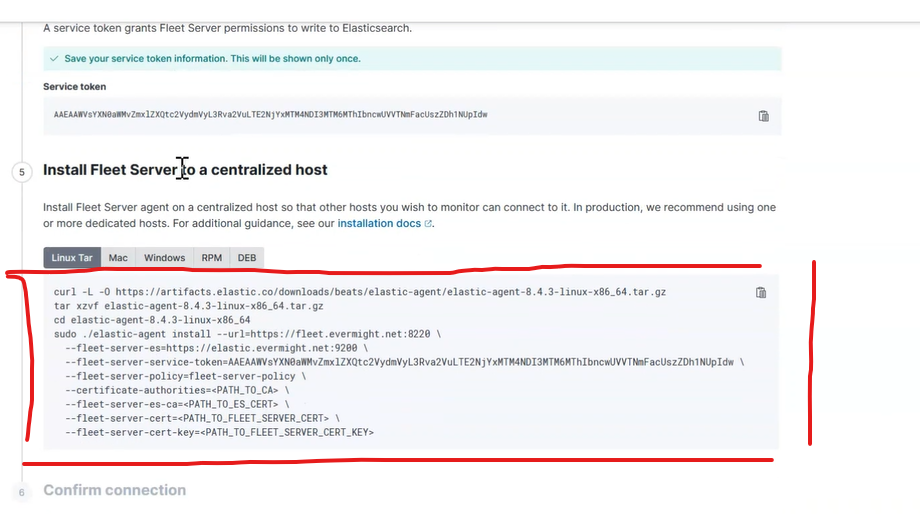
You can delete the --certificate-authorities and --fleet-server-es-ca when using publicly signed SSL, as is our case.
Then update the certificate flags in your instructions to use --fleet-server-key=/etc/certs/<fleet-server-domain>/privkey1.pem and --fleet-server-cert=/etc/certs/<fleet-server-domain>/fullchain1.pem.
Run the command to install the elastic agent and the fleet server.
Go back to Kibana and confirm that the Elastic Agent Fleet Server is visible at Fleet > Agents as shown below:
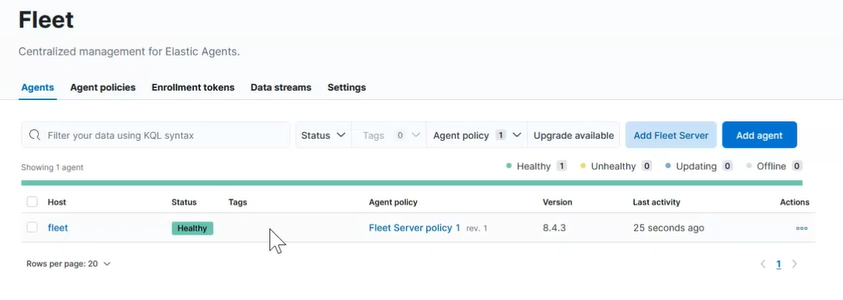
Step 6 - Setup Integration for Application Performance Monitoring [20:20]
Go to Menu and click Integrations and search for Elastic APM and click on it to see this:
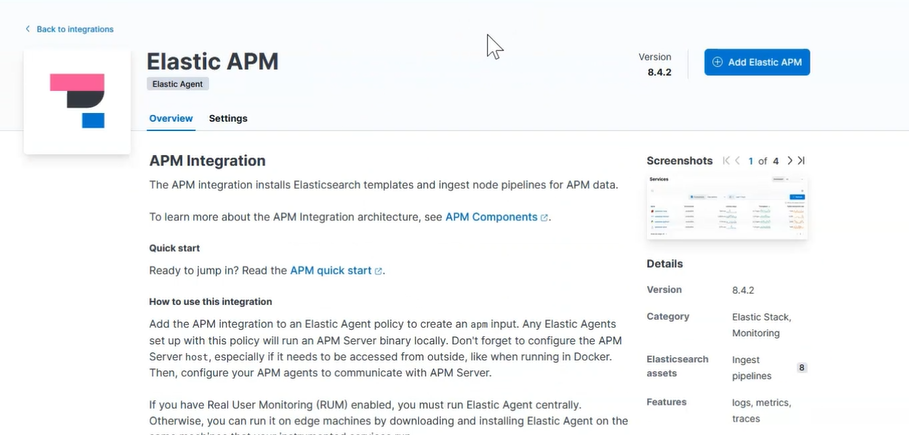
Click Add Integration in the top right corner and start filling out the fields:
Integration name: anything you want
Host: <fleet-server-domain>:8200
URL: https://<fleet-server-domain>:8200
Enable TLS: Enabled
File path to server certificate: /etc/certs/<fleet-server-domain>/fullchain1.pem
File path to certificate key: /etc/certs/<fleet-server-domain>/privkey1.pem
Secret token: <anything-you-want>
And for Where to add this integration?, pick Existing hosts > Agent policy > Fleet Server policy 1 to add this integration to the same server running the Fleet Server.
Then press Save and continue.
Step 7 - Instrument a NodeJS Application [25:30]
An example nodejs application that's been instrumented and will communicate with the Fleet Server APM.
Download this NodeJS project which has already been instrumented.
Edit the secretToken and serverUrl in index.js.
Type npm install to download all necessary dependencies.
Type node index.js to run the application.
Go to your web browser and visit the urls mentioned in the index.js to ship data to the APM and Fleet Server.
Step 8 - Instrument a Go Application [37:55]
An example go application that's been instrumented and will communicate with the Fleet Server APM.
Download this Go project which has already been instrumented.
Edit the ELASTIC_APM_SERVER_URL and ELASTIC_APM_SECRET_TOKEN in .env.
Type go get to download all necessary dependencies.
Type go run main.go to run the application.
Go to your web browser and visit the urls mentioned in the main.go to ship data to the APM and Fleet Server.
