Introduction
Code on Github: Elasticsearch and Application Performance Monitoring
We will setup Application Performance Monitoring with Elasticsearch and Kibana. If you do not have APM, Elasticsearch and Kibana set up yet, then follow these instructions for Part 1 and This for Part 2.
This video assumes you are using Publicly Signed Certificates. If you are using Self Signed Certificates, go here TBD.
Requirements
- A running instance of Elasticsearch and Kibana.
- A new instance of Ubuntu 20.04 to act as the Fleet Server
Steps
Step 1 - Use Server Log to write alerts to kibana.log file [02:12]
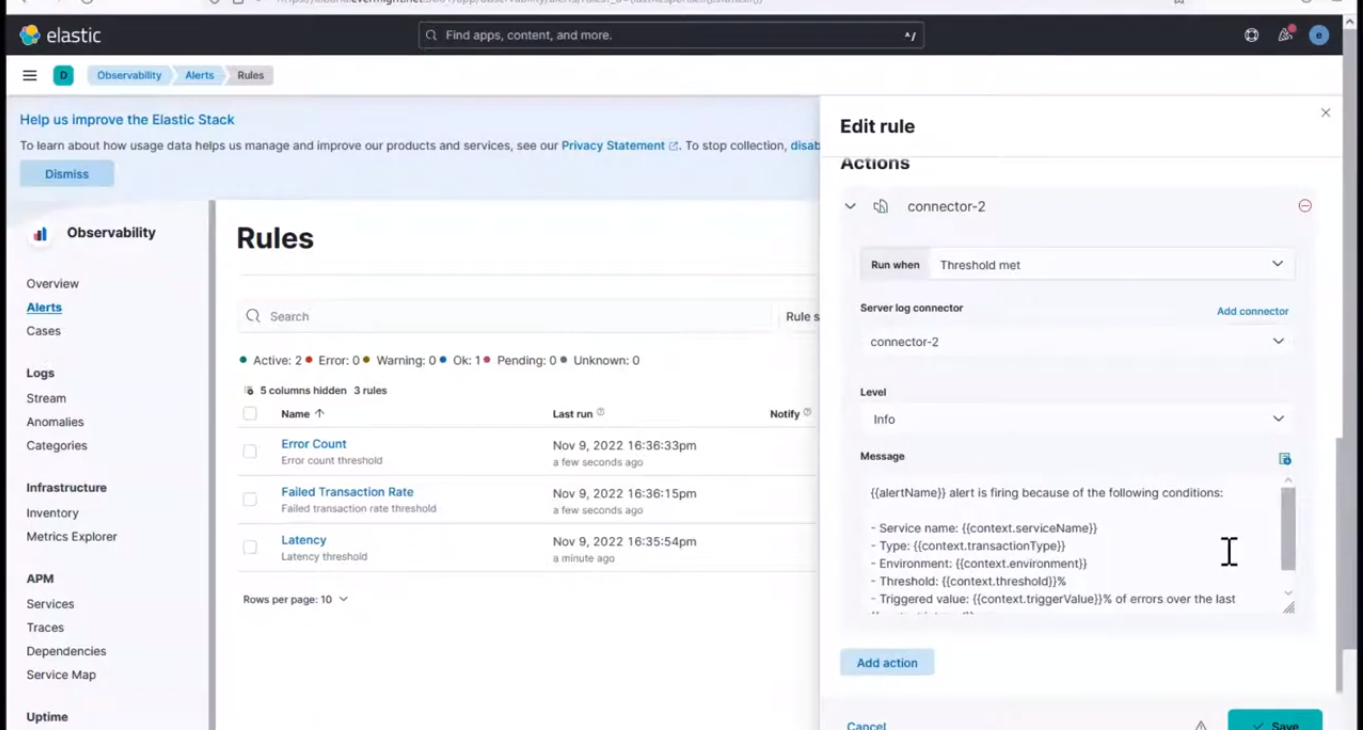
Login to kibana, and go to Observability > Alerts > manager rules, and click on the pen icon on the Error count alert we set up in the previous video.
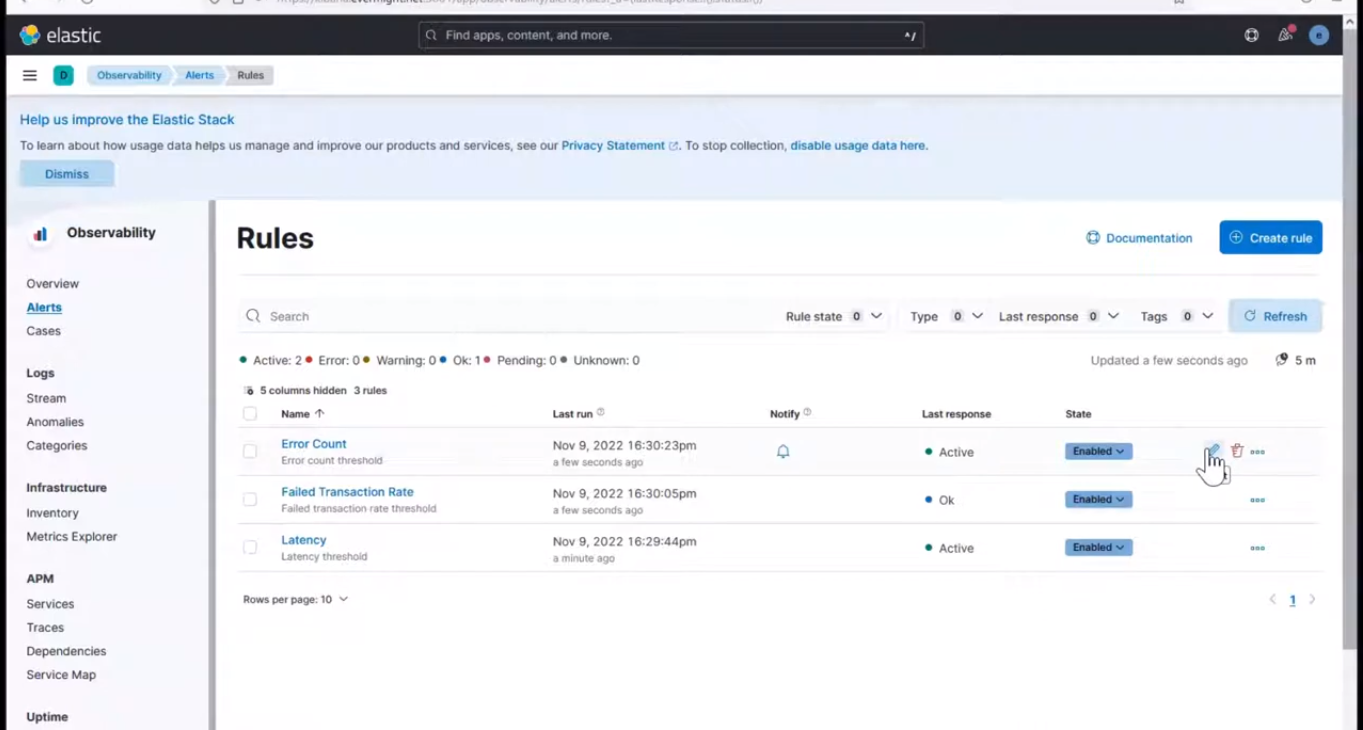 Edit rule
Scroll down, and click on Add a connector, it should show something similar to below
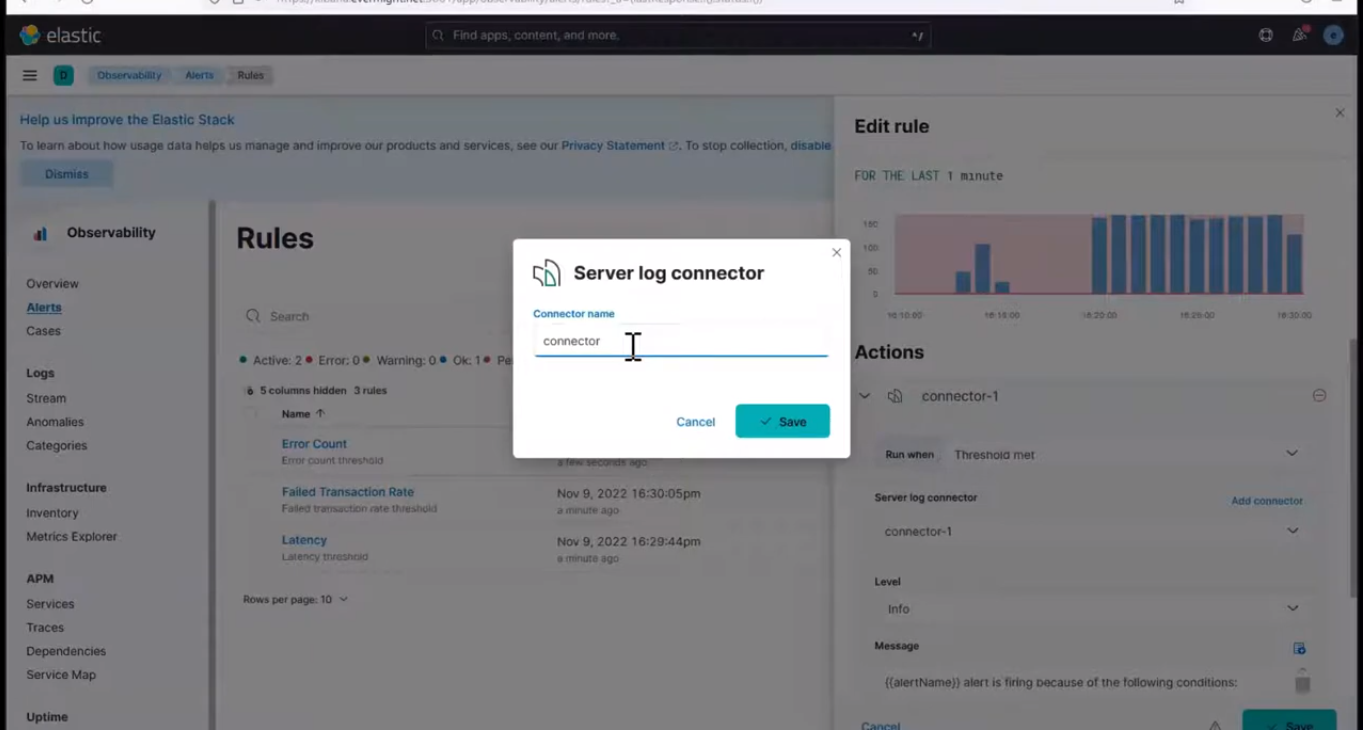 Add a Connector
and give it a name like connector-2, and then press save. Now click on save at the bottom right corner to save the connection details.
To view the logs been published, go to your kibana server terminal and run the below.
cd /var/log/kibana
vi kibana.log
Now go to kibana to setup an alert for Latency Rate threshold. select connector-2 for the connector option and choose the remaining details as shown in the image below
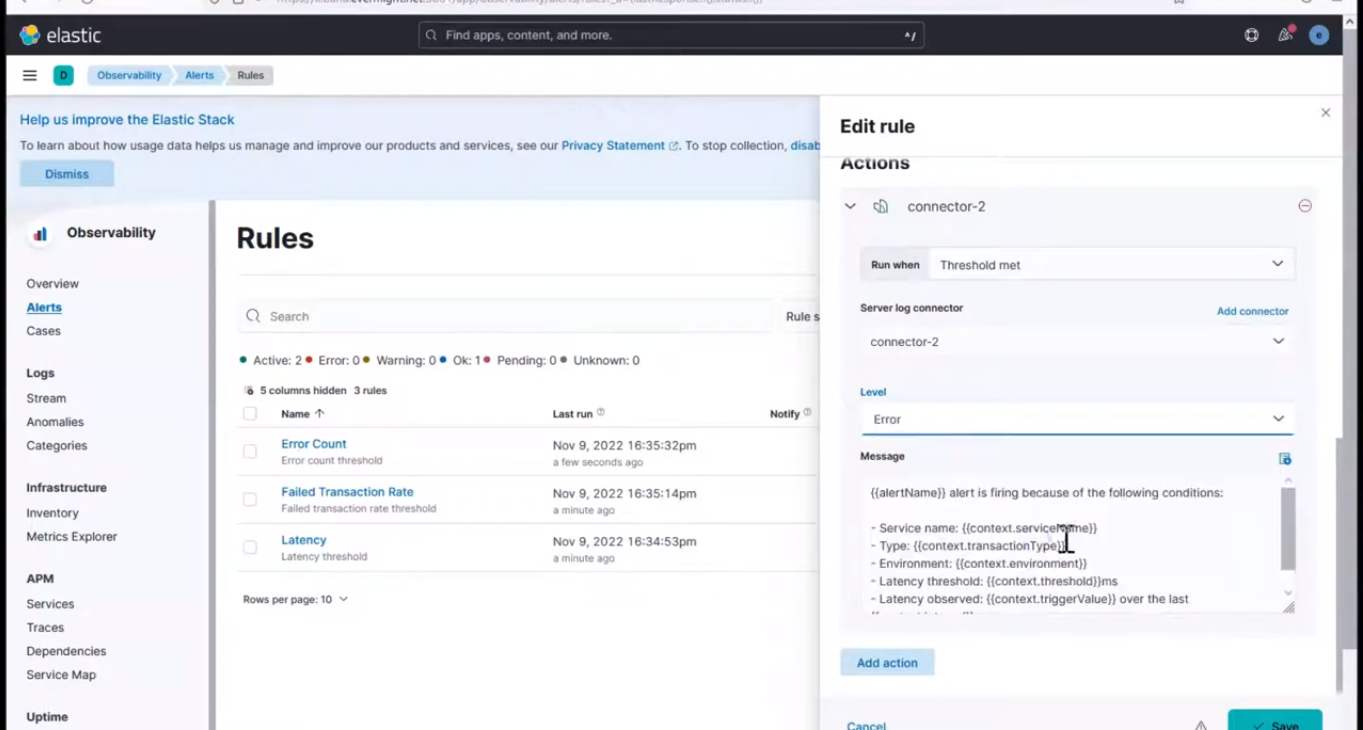 Latency Rate Connection
Do the same for Failed Transaction Alert.
 Failed Transaction Alert
Step 2 - Use logstash to ingest alerts from kibana.log file [09:20]
Install logstash with the below command on your terminal
sudo apt-get update && sudo apt-get install logstash
To confirm logstash was installed successfully, run the below command.
cd /usr/share/logstash/bin/
ls
You should get something similar to this:
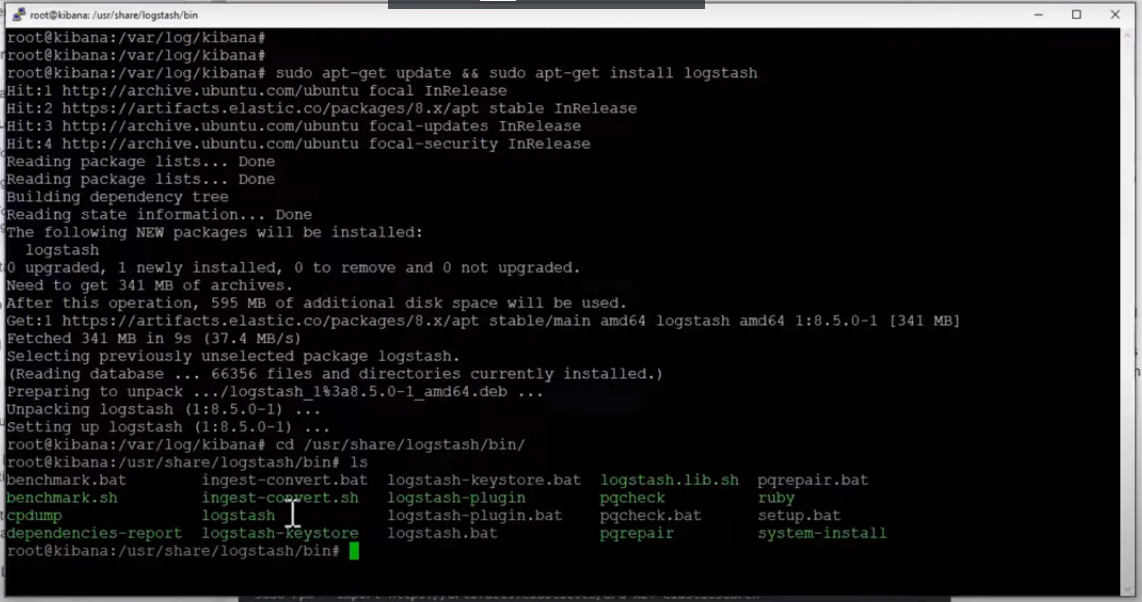 Logstash Binary Files
Use the below command to run logstash.
cd ~
/usr/share/logstash/bin/logstash -e 'input {
    file {
        type => "json"
        codec => "json"
        path => "/var/log/kibana/kibana.log"
        start_position => beginning
    }
}
output  {
    stdout {}
}'
Step 3 - Use logstash to publish alerts to mailtrap or an SMTP server [14:50]
Create an account on Mailtrap as shown in the video, for you will use the smtp server url to act as email. Now go back to the terminal and run the below command.
/usr/share/logstash/bin/logstash -e 'input {
    file {
        type => "json"
        codec => "json"
        path => "/var/log/kibana/kibana.log"
        start_position => beginning
    }
}
output  {
    email {
        to => "<user@example.com>"
        from => "<user@example.com>"
        subject => "Alert: %(message)"
        body => "%(message)"
        authentication => "plain"
        address => "smtp.mailtrap.io"
        domain => "smtp.mailtrap.io"
        port => 2525
        username => "<Your Username>"
        password => "<Your Password>"
    }
}'
Step 4 - Conditional output (eg. email only [log][level] == ERROR) [20:20]
If you want only Log Level Error, then use the below command.
/usr/share/logstash/bin/logstash -e 'input {
    file {
        type => "json"
        codec => "json"
        path => "/var/log/kibana/kibana.log"
        start_position => beginning
    }
}
output  {
  if [log][level] == "ERROR"
    email {
        to => "<user@example.com>"
        from => "<user@example.com>"
        subject => "Alert: %{message}"
        body => "%{message}"
        authentication => "plain"
        address => "smtp.mailtrap.io"
        domain => "smtp.mailtrap.io"
        port => 2525
        username => "<Your Username>"
        password => "<Your Password>"
    }
}'
Step 5 - Use grok filter to format messages [22:05]
To use grok filter, go back to the terminal and run the below command.
/usr/share/logstash/bin/logstash -e 'input {
    file {
        type => "json"
        codec => "json"
        path => "/var/log/kibana/kibana.log"
        start_position => beginning
    }
}
filter {
    grok {
        match => {
            "message" => "Server log: %(DATA:apmreason):;;- Service name: %(DATA:apmservice);-
        }
    }
}
output  {
    email {
        to => "<user@example.com>"
        from => "<user@example.com>"
        subject => "Alert: %{apmservice} %{apmreason}"
        body => "%{message}"
        authentication => "plain"
        address => "smtp.mailtrap.io"
        domain => "smtp.mailtrap.io"
        port => 2525
        username => "<Your Username>"
        password => "<Your Password>"
    }
}'