Introduction
Code on Github: Elasticsearch and Application Performance Monitoring
We will setup Application Performance Monitoring with Elasticsearch and Kibana. If you do not have APM, Elasticsearch and Kibana set up yet, then follow these instructions.
This video assumes you are using Publicly Signed Certificates. If you are using Self Signed Certificates, go here TBD.
Requirements
- A running instance of Elasticsearch and Kibana.
- A new instance of Ubuntu 20.04 to act as the Fleet Server
Steps
Step 1 - Configuring Kibana server to enable alerts [05:30]
Follow the steps below to be able to setup rules in Kibana
cd /usr/share/kibana/bin/
and run the below code.
./kibana-keystore add xpack.encryptedSavedObjects.encryptionKey
and when prompted to enter a value, then paste in any string that is atleast 32 character long. Then restart kibana.
systemctl restart kibana.service
Step 2 - Demonstrate Error Count Threshold alert rule [08:45]
Login to kibana, and go to Observability > Alerts > Rules, and click on create rule as shown in the image below:
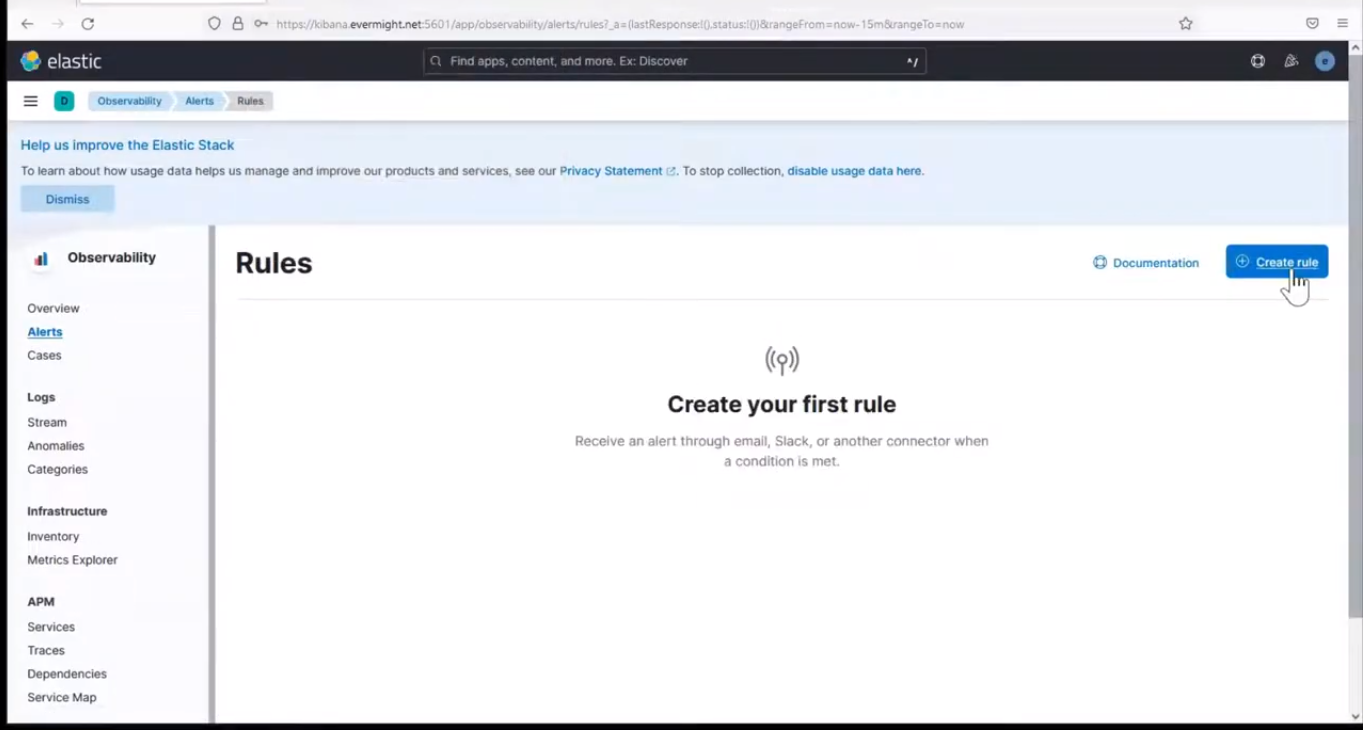 Create Rule
Name: Error Rule Threshold
Check every: 1 minute
Notify: every time alert is active
then click on Error count threshold.
SERVICE: ALL
ENVIRONMENT: ALL
IS ABOVE: 2 errors
FOR THE LAST: 1 minute
Then press save.
Now refresh either the Go app or Nodejs app several times in quick fashion. Once that's done, go back to Observability > Alerts to see the alert show up as shown in the image below:
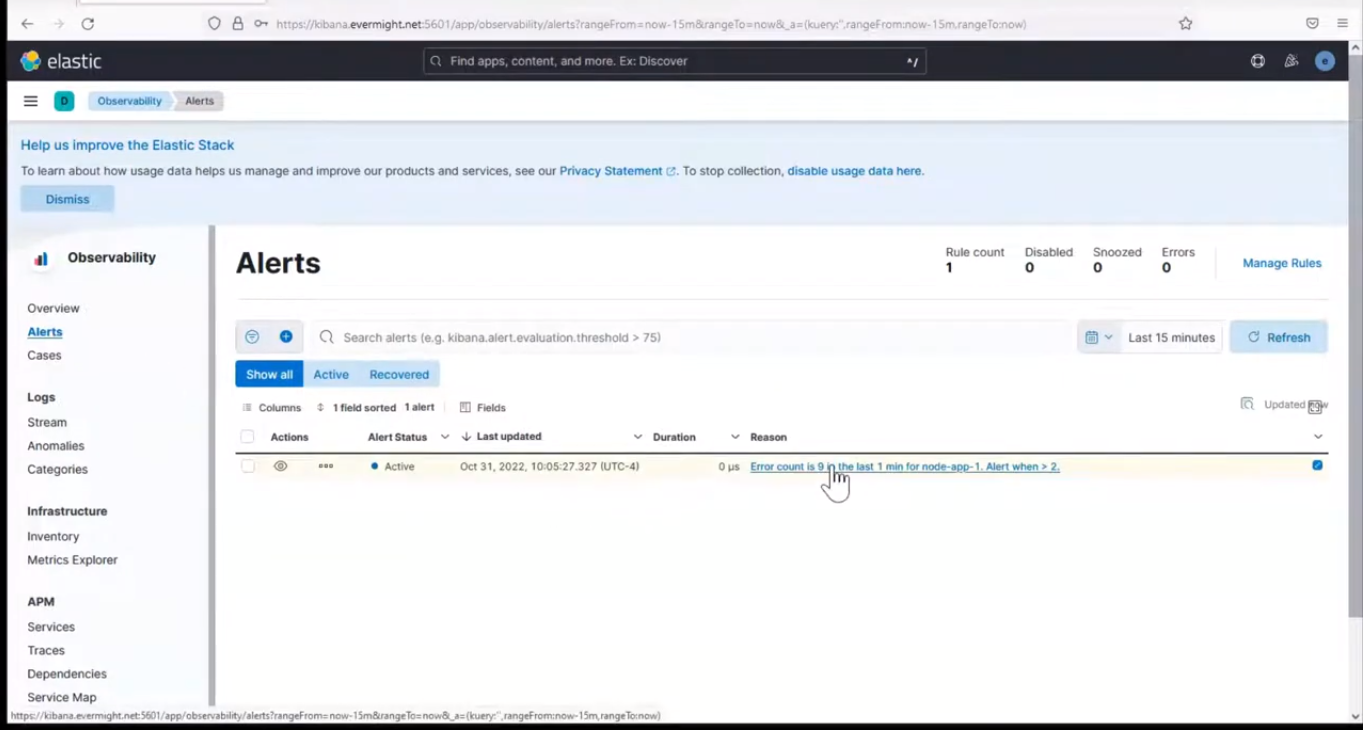 Error Count Threshold Alert
You can repeat refreshing the second app
Step 3 - Demonstrate Failed Transaction Rate Threshold alert rule [18:56]
Go to Observability > Alerts > Rules, and click on create rule as shown in the image below:
Create Rule
Name: FailedTx Rate
Check every: 5 minute
Notify: only on status change
then click on Failed transaction rate thresold.
SERVICE: ALL
ENVIRONMENT: ALL
IS ABOVE: 2%
FOR THE LAST: 10 minute
Then press save.
now open the nodejs app index.js file
vi node/apm/index.js
paste this into the file
app.get('/fail', async (req, res) => (
    const statnum = 500
    res.status(statnum).send('Fail ' + statnum)
))
then restart the nodejs service
systemctl stop nodeapm.service
systemctl stop nodeapm.service
Now ping the endpoint concistently for about 10 minutes, and then go back to check in the alerts and we will have something as similar as the image shown below
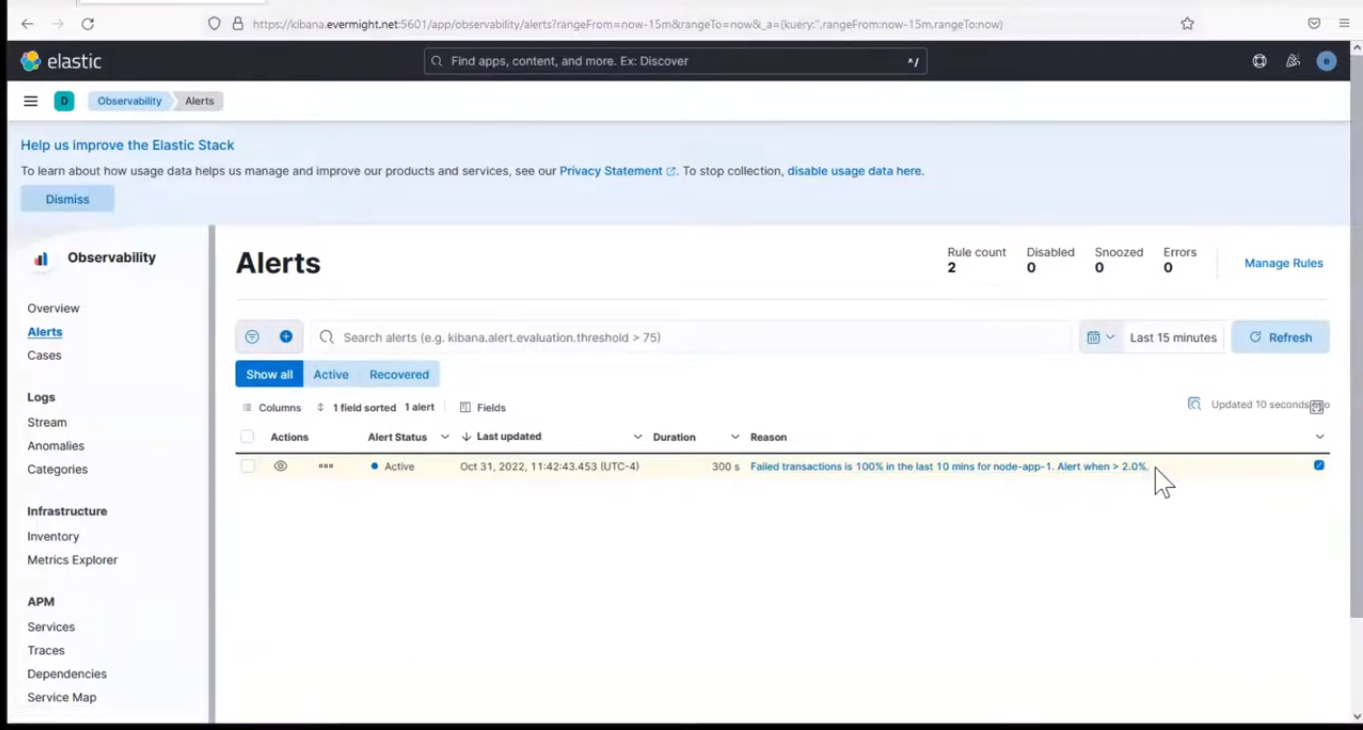 Failed Transaction Rate Alert
Step 4 - Demonstrate Latency Threshold alert rule [28:46]
Go to Observability > Alerts > Rules, and click on create rule as shown in the image below:
Create Rule
Name: Latency Threshold
Check every: 1 minute
Notify: only on status change
then click on Latency thresold.
SERVICE: node-app-1
TYPE: request
ENVIRONMENT: ALL
WHEN: avg
IS ABOVE: 100ms
FOR THE LAST: 5 minutes
Then press save.
You should see something similar to the below image when you hit refresh:
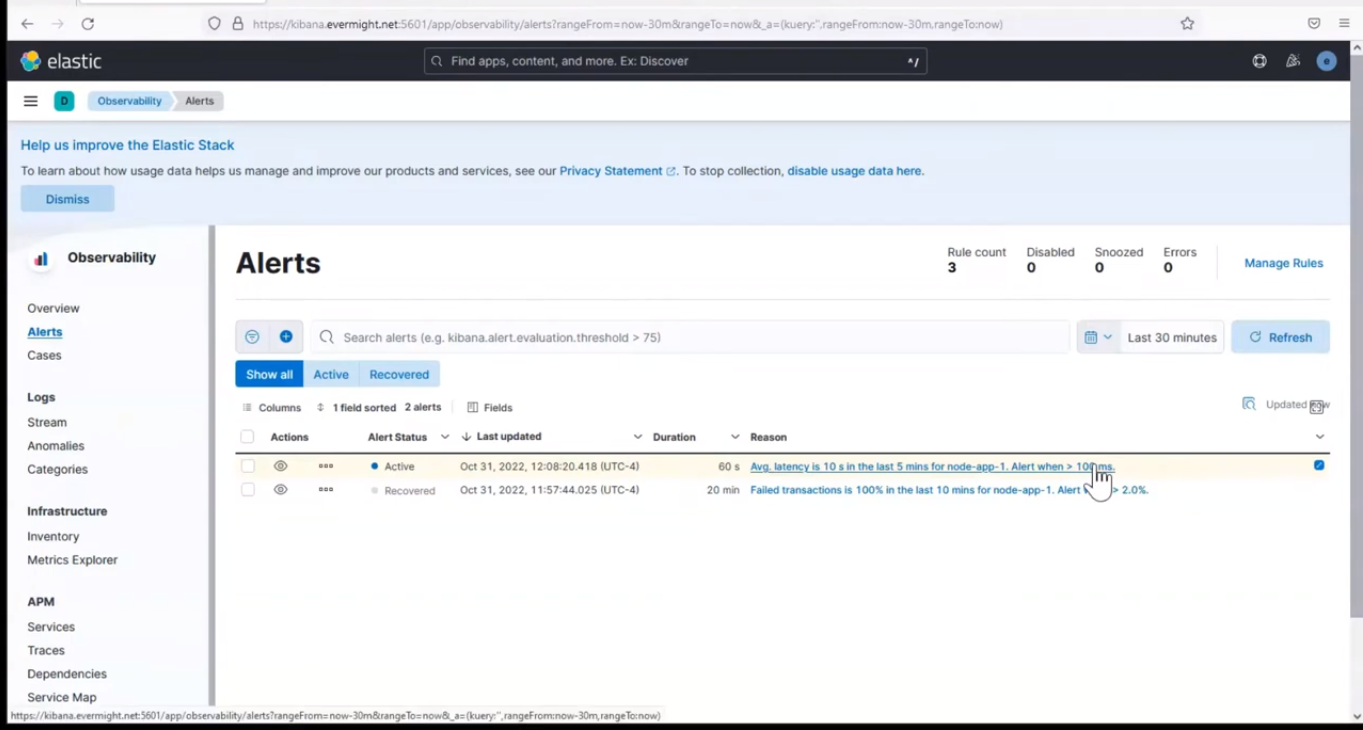 All three Alerts
now open the nodejs app index.js file
vi node/apm/index.js
paste this into the file
app.get('/latency', async (req, res) => (
    const t = 10000
    await new Promise(resolve => setTimeout(resolve, t))
    res.send('Wait ' + t)
))
then restart the nodejs service
systemctl restart nodeapm.service
Now ping the endpoint concistently for about 10 minutes, and then go back to check in the alerts and we will have something as similar as the image shown below
Latency Threshold Alert